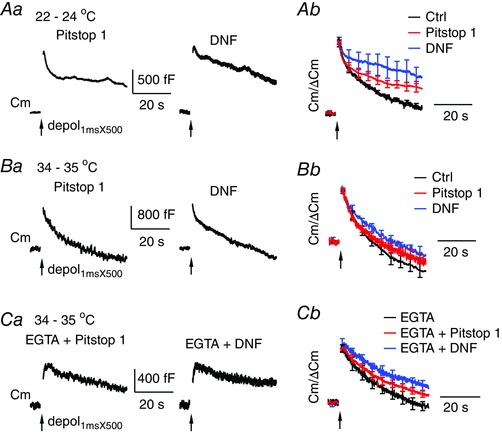
Figure 9. Clathrin‐mediated endocytosis has a minor contribution to endocytosis at near physiological temperature.

A, sampled Cm responses (Aa) to depol1msX500 from calyces dialysed with 80 μm Pitstop 1 or 100 μm DNF at 22–24°C. Ab, average Cm traces after normalization to ΔCm are superimposed for control (Fig. 7), Pitstop 1 (n = 11) and DNF (n = 7). B, same as in (A), except that data are from tests performed at 34–35°C. Bb, superimposed traces are for control (Fig. 7), Pitstop 1 (n = 6) and DNF (n = 8). C, sampled Cm responses (Ca) to depol1msX500 under dialysis with 10 mm EGTA and 80 μm Pitstop 1, or EGTA and 100 μm DNF, at 34–35°C. Cb, average Cm traces after normalization to ΔCm are superimposed for EGTA (Fig. 7 A and B), EGTA and Pitstop 1 (n = 6) and EGTA and DNF (n = 7).
