
Figure 7. Changes in the number of myogenin+ cells during regeneration.
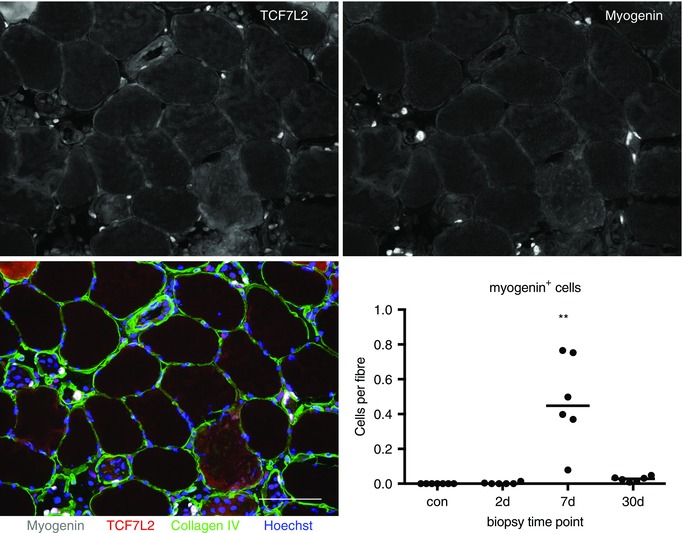
The number of myogenin+ cells was determined on cross‐sections of biopsies stained for fibroblasts (TCF7L2), myogenin, collagen IV and Hoechst, as shown for one of the 7 day samples analysed in this study. Single channel images are displayed for TCF7L2 and myogenin, and the four‐channel merged image; scale bar = 100 μm. A similar number of fibroblasts was observed to be located around fibres with, vs. fibres without, myogenin+ cells. For the enumeration of myogenin cells, individual (and median) values are displayed; ** P < 0.01, vs. con.