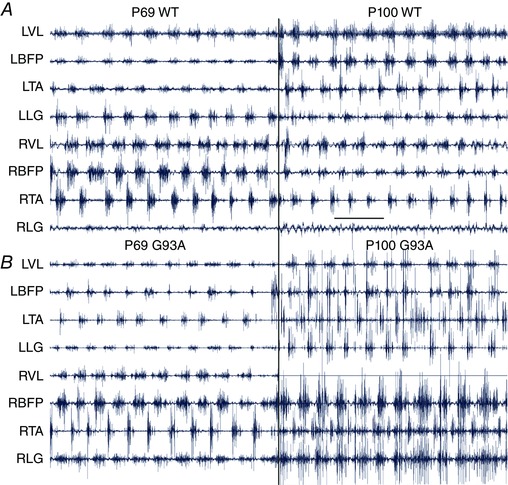
Figure 1. In vivo EMG recording.

Raw EMG traces (prior to digital filtering, rectification and averaging) from two mice: one SOD1WT (A) and one SOD1G93A (B). At P69, G93A mice are pre‐symptomatic (left traces) and, at P100, mice are symptomatic (right traces). Muscle labels apply to traces on both left and right. Scale bar in (A) = 500 ms applies to all. [Color figure can be viewed at wileyonlinelibrary.com]
