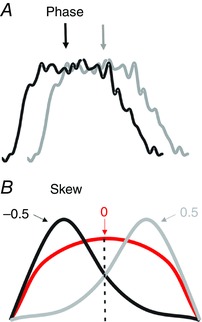
Figure 2. Schematic of methods for measurement of burst parameters.

All measurements were taken from rectified and averaged traces. A, mean phase was determined from the timing of activity within the locomotor cycle (using onset of activity in VL as the marker of cycle onset). B, idealized traces illustrating three bursts with different measures of skew. All three bursts have the same mean phase. The red trace has activity that is symmetrically located around its mean phase and so corresponds to a skew value of 0. The black trace has most of its activity located to the left of its mean and so corresponds to a negative skew value. The grey trace has most of its activity located to the right of its mean, corresponding to a positive skew value.
