
Figure 8. Intermuscular phasing measurements.
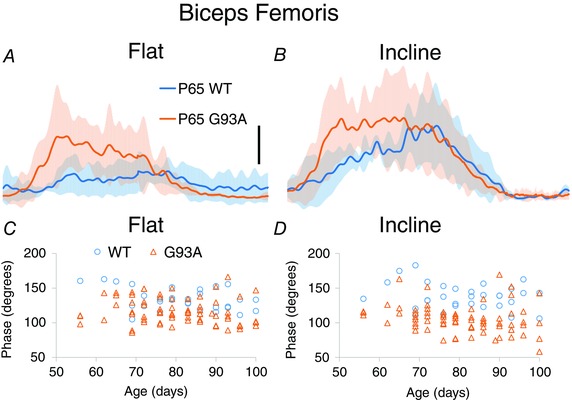
A and B, averages of BFP showing phase advance at P65. SD of averaged traces is indicated by the semitransparent shading above and below the averaged traces. C and D, individual measurements of phase in BFP, plotted by age. Phase significantly advances in G93A in interaction with incline.