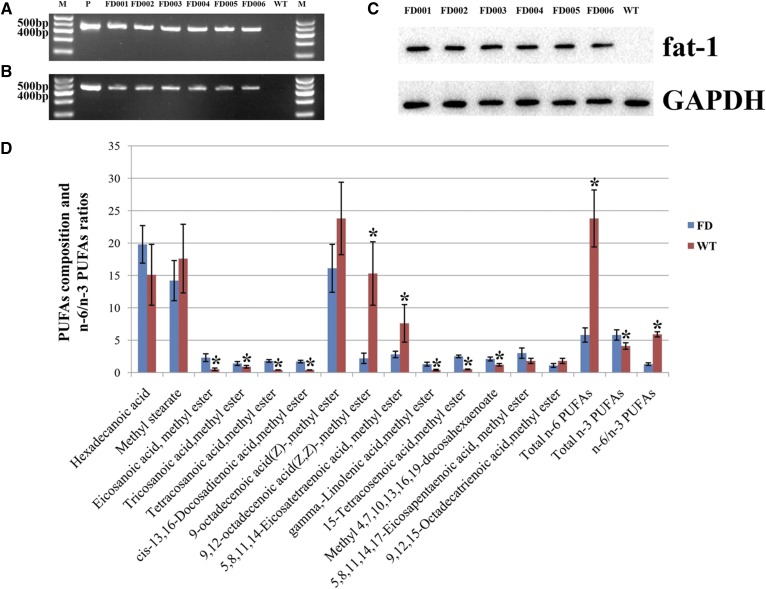
Fig. 1.
Identification for the fat-1 transgenic cattle. A: Detection of fat-1 gene (450 bp) delivered into transgenic cattle by PCR. B: Detection of fat-1 gene (450 bp) expression in transgenic cattle by RT-PCR. The fat-1 expression vector was used as the template for the positive control (P) and WT cattle were used as the negative control. C: Detection of the protein expression of fat-1 gene in transgenic cattle by Western blot. D: Analysis of the fatty acid composition in the tissues of fat-1 transgenic cattle. Fatty acids were measured as methyl esters by gas chromatography. Bars represent the mean ± SD from six ear samples in each group (six transgenic calves (FD) and six age-matched WT calves) with two independent measurements for each sample. Significant differences of fatty acid composition in the tissues were found between the WT cattle and transgenic cattle (*P < 0.05).

