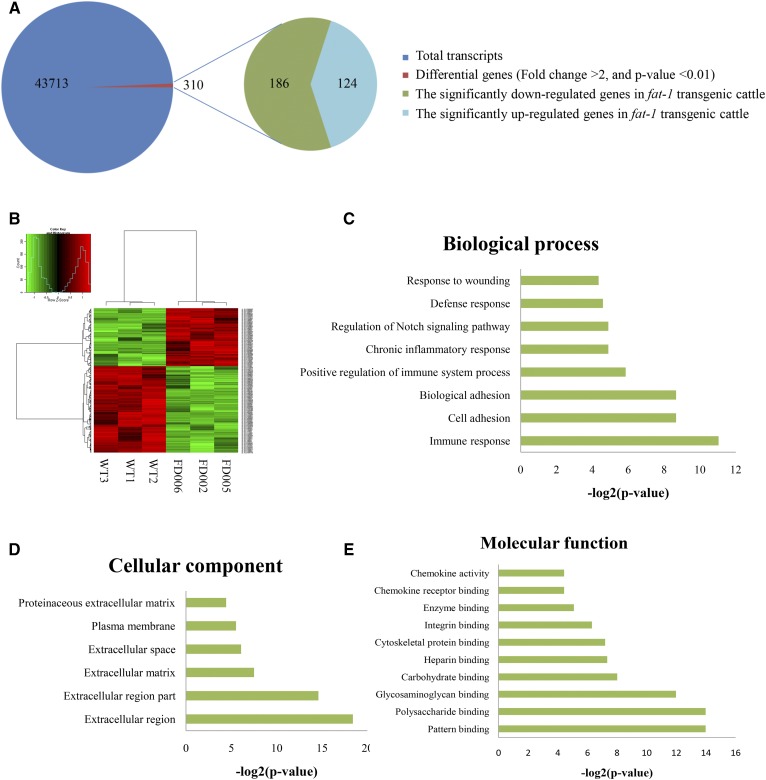
Fig. 2.
Analysis of gene expression in the fat-1 transgenic cattle. A: Schematic represents the differentially expressed genes between fat-1 transgenic cattle and WT cattle. B: The analysis on hierarchical clustering of the expressed genes in fat-1 transgenic cattle and WT cattle. C: Classification of microarray biological process. D: Classification of microarray cellular components; E: Classification of microarray molecular function. The x axis indicates the likelihood [−log2(P-value)] in a category and the y axis indicates the different subcategories of biological process.

