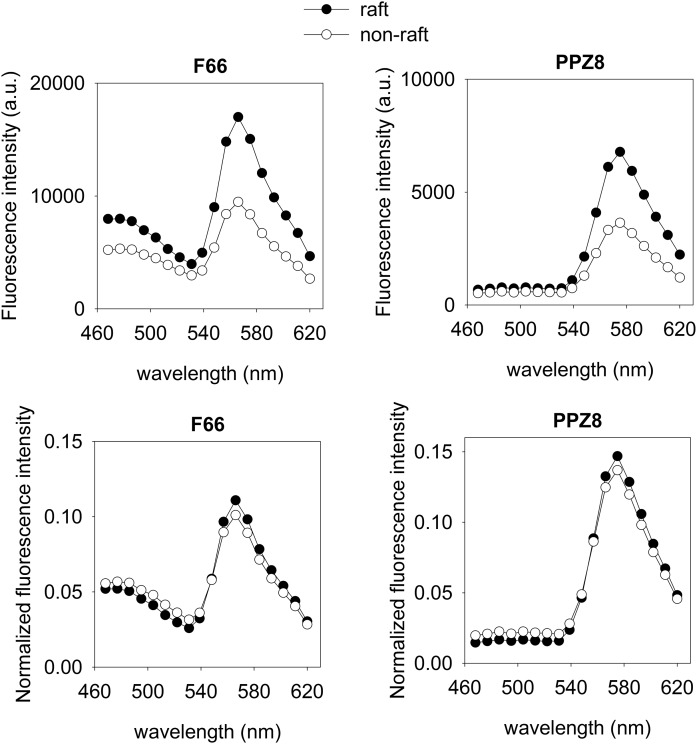
Fig. 3.
Emission spectra of F66 and PPZ8 inside and outside lipid rafts. Cells were labeled with the dipole potential sensitive dyes F66 or PPZ8 and with the lipid raft marker, AlexaFluo647-CTX-B. The emission spectrum of the dipole potential-sensitive dyes was recorded on a pixel-by-pixel basis (a.u., arbitrary units). Lipid rafts correspond to high-intensity areas identified in the CTX-B images. The emission spectra were averaged separately for pixels in the raft and nonraft regions. Nonnormalized spectra are shown in the top panels. To cancel the effect of water quenching, we normalized spectra to the total fluorescence emission, and these normalized curves are shown in the bottom panels.

