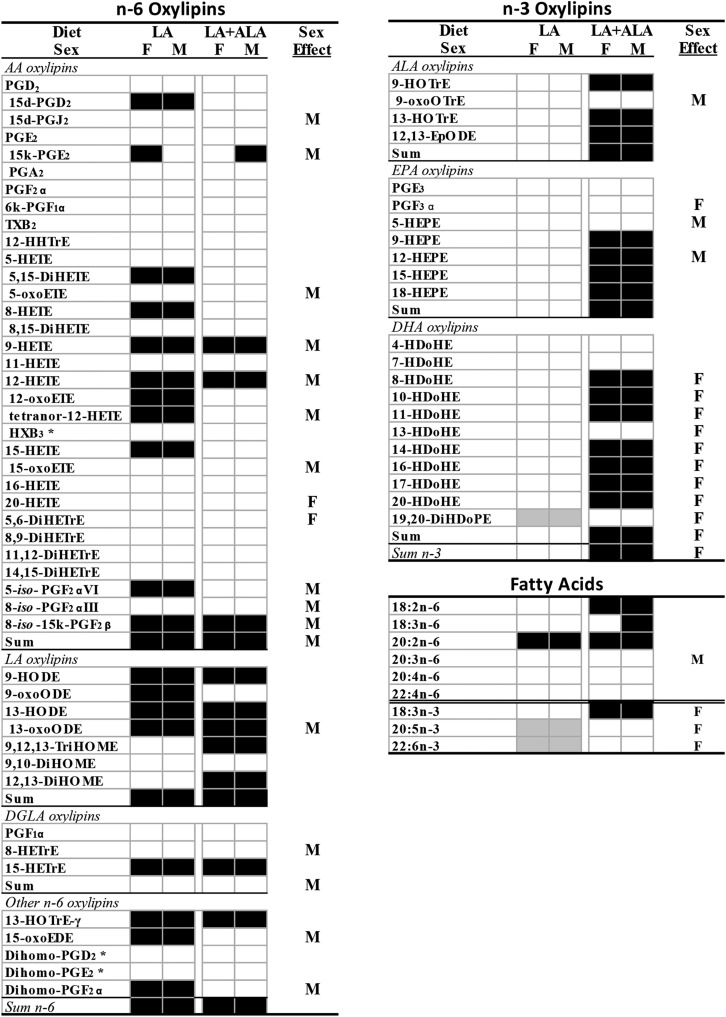
Fig. 2.
Differences in kidney oxylipins and fatty acids in rats given LA and LA+ALA compared with control diets for 6 weeks. Oxylipins that are higher (black boxes) or lower (gray boxes) than the control diet are denoted by shading. Sex effects in at least one of the diets are denoted by M (higher in males) or F (higher in females). Means, SEs, and P values are shown in supplemental Tables S5 and S8. *Denotes no primary standard so not quantified and not included in the sums. d, deoxy; DiHDoPE, dihydroxy-docosapentaenoic acid; DiHETrE, dihydroxy-eicosatrienoic acid; DiHOME, dihydroxy-octadecenoic acid; EpODE, epoxy-eicosadienoic acid; HDoHE, hydroxy-docosahexaenoic acid; HEPE, hydroxy-eicosapentaenoic acid; HETrE, hydroxy-eicosatrienoic acid; HHTrE, hydroxy-heptadecatrienoic acid; HOTrE, hydroxy-octadecatrienoic acid; HX, hepoxilin; k, keto; oxoEDE, oxo-eicosadienoic acid; oxoETE, oxo-eicosatetraenoic acid; oxoODE, oxo-octadecadienoic acid; oxoOTrE, oxo-octadecatrienoic acid; PG, prostaglandin; TriHOME, trihydroxy-octadecenoic acid; TX, thromboxane.

