
Figure 4. MMP‐9 activity at dendritic spines and analysis of dendritic spine morphology.
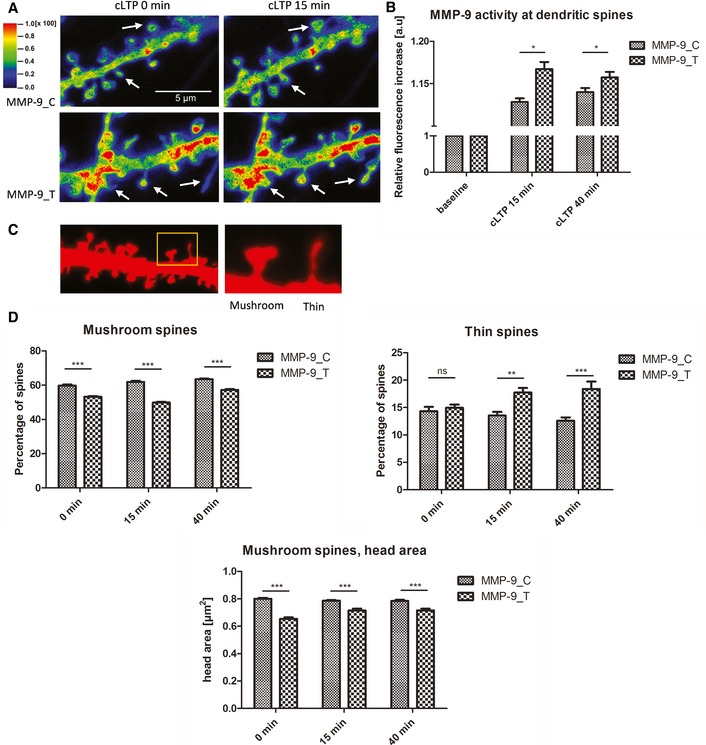
- Exemplary images from FITC‐tagged gelatin (DQ‐gelatin) assay showing colocalization map of FITC fluorescence that corresponds to gelatinolytic activity. Red fluorescent protein was used to label cell morphology, showing a short stretch of dendrite that overexpressed either the MMP‐9_C or MMP‐9_T variant. Warmer colors correspond to higher gelatinolytic activity. Dendritic spines with an increase in gelatinolytic activity are marked with arrows.
- Quantification of analyzed data from four separate experiments. The relative increase in fluorescence was measured for individual spines over time as a readout of MMP‐9 activity. A total of 17 cells (MMP‐9_C) or 13 cells (MMP‐9_T) were analyzed.
- Image from morphological analysis of spines from primary rat hippocampal neurons showing example of mushroom and thin spine shapes.
- The rs20544 polymorphism influenced the percent distribution of spine shape. Quantification of percent distribution of mushroom and thin spines from time‐lapse imaging from three separate experiments. Neurons that overexpressed MMP‐9_C had more mushroom spines and less thin spines than the MMP‐9_T variant. For each polymorphic variant, six cells were analyzed; the total number of spines analyzed was n spines = 419 for MMP‐9_C and n spines = 465 for MMP‐9_T.