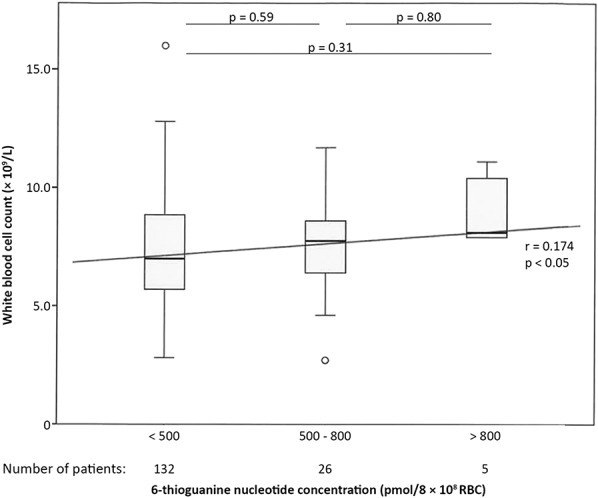
FIGURE 3.

Correlation between 6-thioguanine nucleotide concentrations and WBC count in patients using 6-thioguanine (n = 163). In this figure, the correlation between the concentration of 6-thioguanine nucleotides and WBC count is depicted among patients using 6-thioguanine. The box-and-whisker plots show inter-group variations; the diagonal line represents the Spearman correlation coefficient.
