
Figure 3.
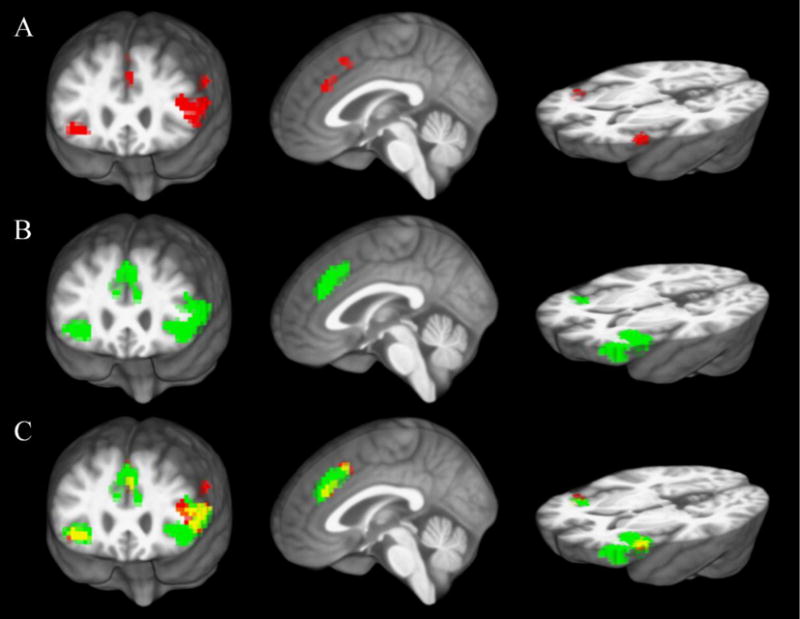
Cingulo-opercular ROIs for (A) adaptive-control effects (red) and (B) error-responses (green). Their overlap (yellow) is shown in (C). ROIs were defined from an independent sample of 18 younger adults and warped into study-specific space.
Official websites use .gov
A
.gov website belongs to an official
government organization in the United States.
Secure .gov websites use HTTPS
A lock (
) or https:// means you've safely
connected to the .gov website. Share sensitive
information only on official, secure websites.
Cingulo-opercular ROIs for (A) adaptive-control effects (red) and (B) error-responses (green). Their overlap (yellow) is shown in (C). ROIs were defined from an independent sample of 18 younger adults and warped into study-specific space.