
Figure 4.
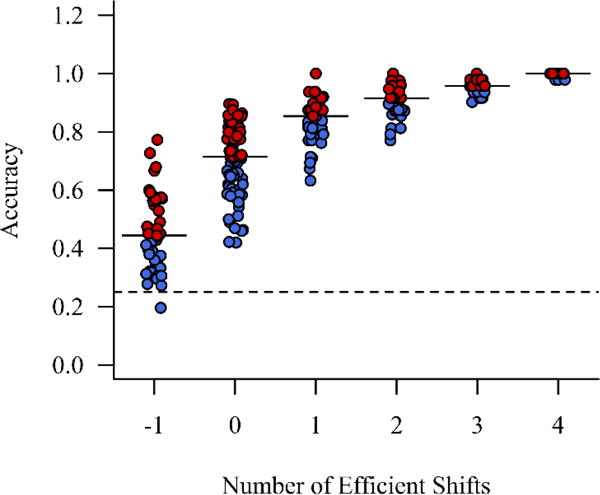
The relationship between number of efficient shifts and accuracy on the WCST. Solid horizontal lines indicate the median for each category of efficient shifts. The dashed line indicates chance accuracy (25%). Individuals who fall above the median (red) have positive accuracy differences and consequently positive persistence values. Individuals who fall below the median (blue) have negative accuracy differences and consequently negative persistence values. For visualization purposes, data have been randomly jittered ±0.1 along the x-axis to reduce overlap. Persistence scores of exactly 0 are plotted in red.