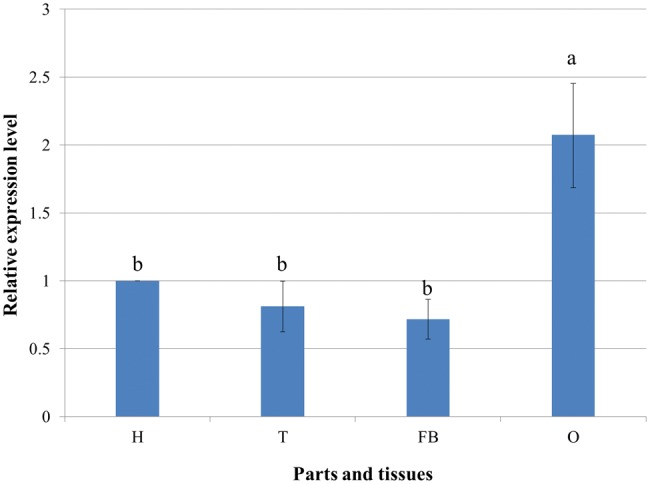
Fig. 4.

Expression pattern of NlRPL5 in different parts and tissues of N. lugens. The mRNA level of NlRPL5 was detected using RT-qPCR. The mRNA level was normalized relative to the Actin transcription levels and the reference was the mRNA level in head of N. lugens. H: Head; T: Thorax; FB: Fat body; O: Ovary. Data were presented as mean ± SD. Symbols of a and b indicate significant differences between each two groups (ANOVA, LSD, P < 0.05).
