
Figure 3.
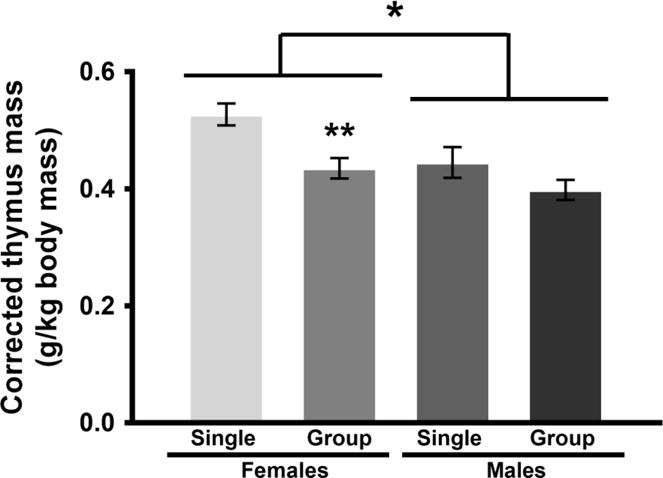
Thymus mass corrected for body mass (g/kg body mass; means ± SE) of male and female Syrian hamsters after 4 weeks of single or group housing in Experiment 1. An ANOVA revealed significant main effects of both sex and housing on thymus mass. Thymus masses were significantly lighter in males compared to females (*p < 0.05, η2 = 0.19). In addition, thymus masses were significantly lighter in group housed animals compared to single housed animals (**p < 0.05, η2 = 0.25).