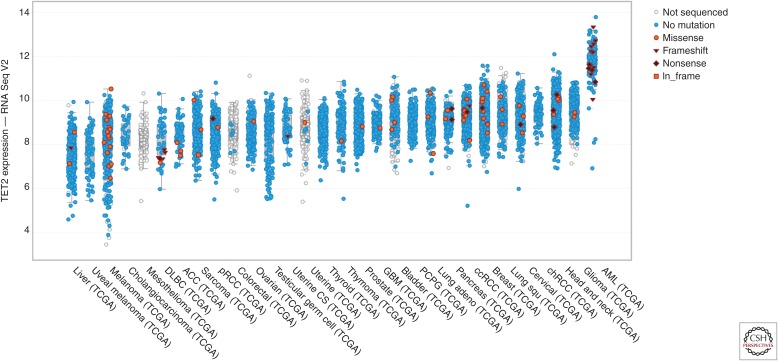
Figure 2.
TET2 expression across malignancy. Normalized RNA-Seq counts (log2) are shown for the indicated malignancies ranked from lowest to highest mean expression of TET2. Samples with frameshift mutations are denoted with an inverted triangle, nonsense mutations are denoted as a diamond, and in-frame mutations are shown with a square. Data was collected and graphed using the cBioPortal (see cbioportal.org/) (Gao et al. 2013).

