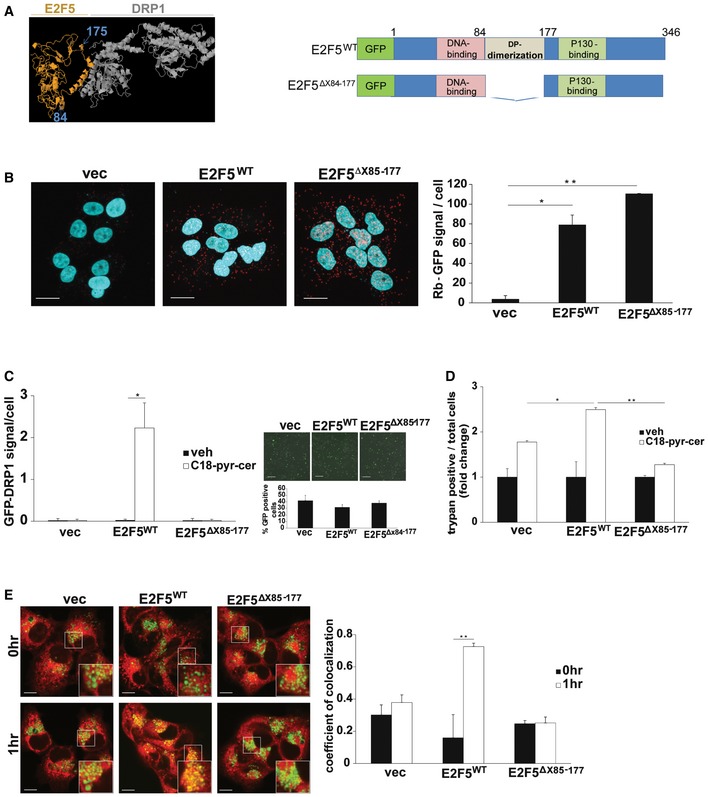
C–EUM‐SCC22A cells expressing vector, E2F5WT or mutant E2F5Δ85–177, were used for the measurement of Drp1‐E2F5 association in the absence/presence of C18‐pyr‐cer (10 μM, 1 h) using PLA (C) compared to vector‐transfected controls. Transfection efficiency and abundance of ectopically expressed E2F5WT‐GFP and mutant E2F5Δ85–177‐GFP were detected by immunofluorescence (scale bars represent 100 μm). Vector‐GFP was used as a control (right panel, C). Moreover, effects of E2F5WT versus mutant E2F5Δ85–177 on cell death or mitophagy in response to C18‐pyr‐cer (20 μM, 48 h) were measured by trypan blue exclusion assay (D) or by live cell imaging confocal micrographs (E) of UM‐SCC‐22A cells stained with LTR and MTDR (MitoTracker deep red, imaged with blue channel, and colored green for imaging). Images were quantified using ImageJ (scale bars represent 100 μm). Data are means ± SD from three independent experiments, analyzed by unpaired Student's t‐test (C and E, n = 3, *P = 0.011, **P = 0.0025) or two‐way ANOVA (D, n = 3, *P = 0.0142, **P = 1.6 × 10⁻⁸).

