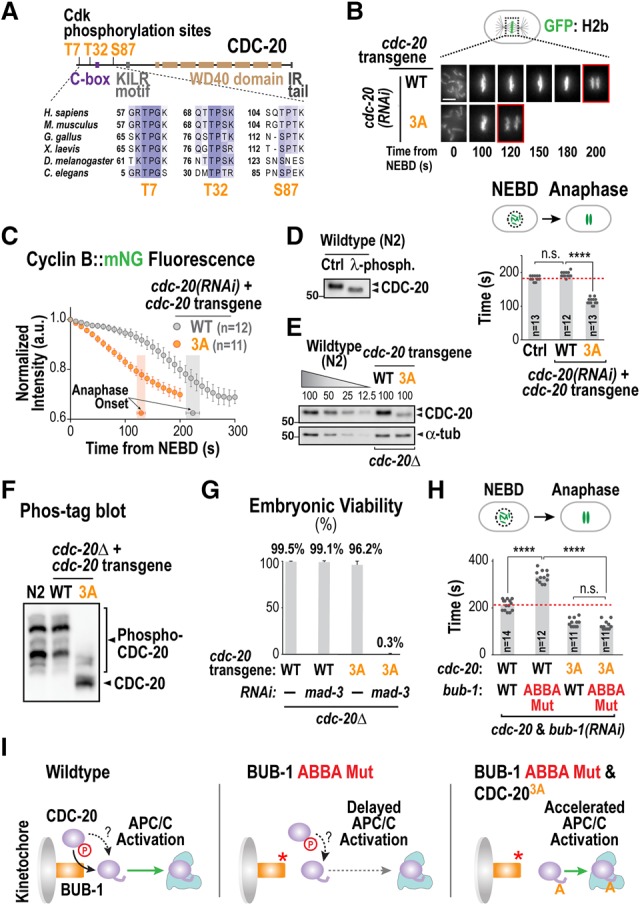
Figure 3.

Cdk phosphorylation of CDC-20 restrains APC/C activation. (A) Schematic of CDC-20 structure and alignment highlighting conserved Cdk sites in the N terminus. (B) Images from time-lapse sequences (top) and quantification of the NEBD–anaphase onset interval (bottom) of embryos expressing GFP::H2b for the indicated conditions. Time below panels is in seconds relative to NEBD. (****) P < 0.0001 (Mann-Whitney test). Bar, 5 µm. (C) Plot of normalized Cyclin B::mNeongreen (mNG) fluorescence as in Figure 1C. (D) Immunoblot of endogenous CDC-20 with and without phosphatase treatment. (E) Immunoblot analysis of transgene-encoded CDC-20 (wild type [WT] or 3A) in the absence of endogenous CDC-20. α-Tubulin served as a loading control. Note that the 3A mutant is expressed at a lower level than wild-type CDC-20 but nonetheless accelerates APC/C activation and anaphase onset. (F) Analysis of CDC-20 phospho-isoforms by immunoblotting of a manganese phos tag gel. (G) Embryo viability analysis for the indicated conditions. At least 14 worms and 1300 embryos were scored per condition. (H) Quantification of the NEBD–anaphase onset interval of embryos expressing GFP::H2b for the indicated conditions. (****) P < 0.0001 (Mann-Whitney test). (I) Schematic summarizing the effect on APC/C activation of disrupting kinetochore localization or N-terminal Cdk phosphorylation of CDC-20. See also Supplemental Figures S3 and S4.
