Figure 7.
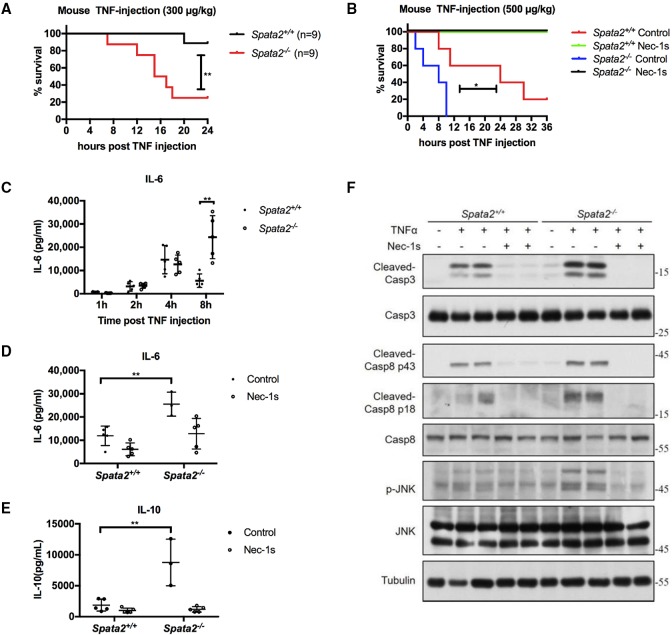
Loss of Spata2 sensitizes mice to TNFα-induced SIRS in vivo. (A) Survival curves of Spata2+/+ and Spata2−/− mice injected with 300 µg/kg mouse TNFα intravenously. (**) P < 0.01. n = 9. Spata2+/+ is marked in black, and Spata2−/− is marked in red. (B) Survival curve of Spata2+/+ and Spata2−/− mice given 40 mg/kg Nec-1s or vehicle control intragastrically 30 min before injection of 500 µg/kg mouse TNFα intravenously. (*) P < 0.05. n = 5. Spata2+/+ with vehicle control is marked in red, Spata2+/+ with Nec-1s is marked in green, Spata2−/− with vehicle control is marked in blue, and Spata2−/− with Nec-1s is marked in black. (C–E) Sera from injected mice were collected at the indicated time points, and IL-6 or IL-10 levels were demonstrated using ELISA. Error bars represent the SEM from three technical replicates. (F) Tissues from the intestines of mice with the indicated treatment for TNFα injection after 3 h were analyzed by Western blotting using the indicated antibodies. Tubulin was used as a loading control.

