
Figure 6.
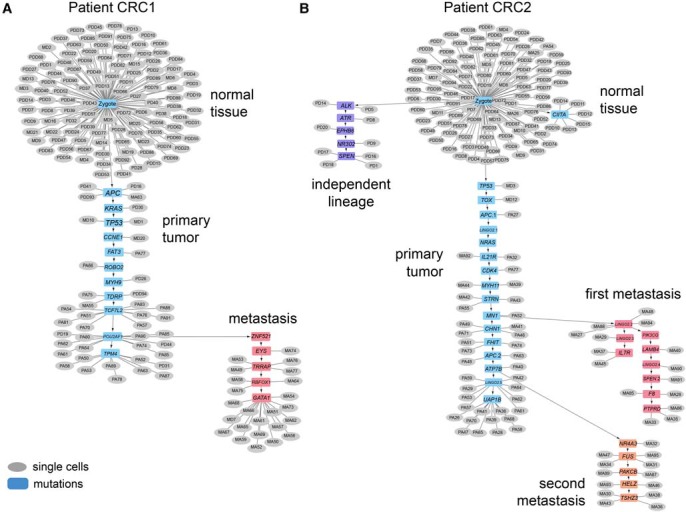
Mutational lineage trees of single cells during metastasis. Mutational trees calculated from single-cell mutation data using SCITE showing clonal lineages during tumor progression and metastasis. (A) Mutational lineage tree from patient CRC1 with a monoclonal seeding event. (B) Mutational lineage tree from patient CRC2 with polyclonal seeding events and an independent tumor lineage. Gray circles represent single cells, while blue boxes represent mutations.