Figure 3.
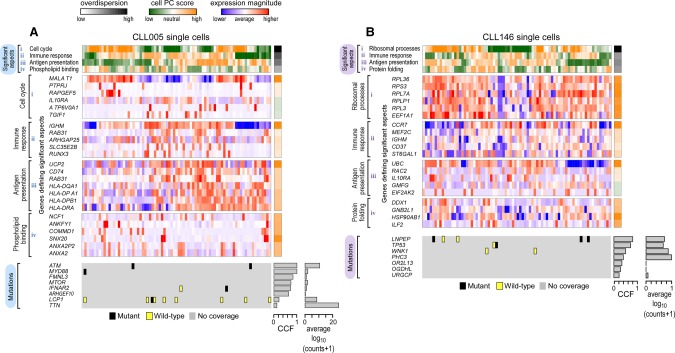
CLL transcriptional heterogeneity revealed by single-cell transcriptome sequencing. Pathway and gene set overdispersion analysis (PAGODA) was used to identify transcriptionally defined subpopulations for CLL005 (A) and CLL146 (B) (for analysis of CLL096 and CLL032, see Supplemental Fig. S6A,B). Based on gene sets defined by MSigDB annotations, significantly overdispersed pathways group cells into coherent and distinct aspects of transcriptional heterogeneity. Aspect scores (Cell PC score) are oriented so that high values generally correspond to increased expression of associated gene sets. Also shown are expression patterns of select genes driving each aspect of transcriptional heterogeneity along with their loading contributions to the aspect scores (left). Mutation information inferred from single-cell transcriptome sequencing is also shown at the bottom. CCF for each mutation derived from bulk tumor WES and the number of reads (log10 transformed) from single-cell transcriptome sequencing are also indicated.

