
Figure 3.
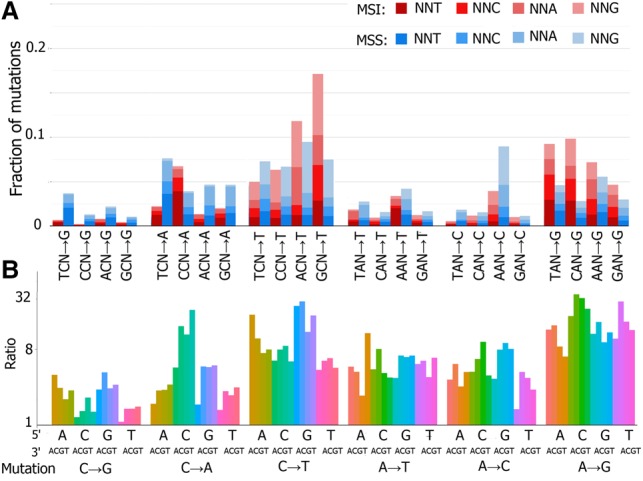
Comparison of mutational spectra of MMR-deficient and MMR-proficient cancers. Complementary mutation types were pooled. Data for MSI (n = 10) and MSS (n = 22) colon adenocarcinoma samples and uterine corpus endometrial carcinoma were pooled. Data for whole-genome sequencing. (A) Relative frequencies of the 96 mutation types (all possible mutation types in all possible tri-nucleotide contexts) in MSI and MSS cancers. (B) Ratio of the rates of each substitution in MSI and MSS cancers. Note the logarithmic vertical axis.