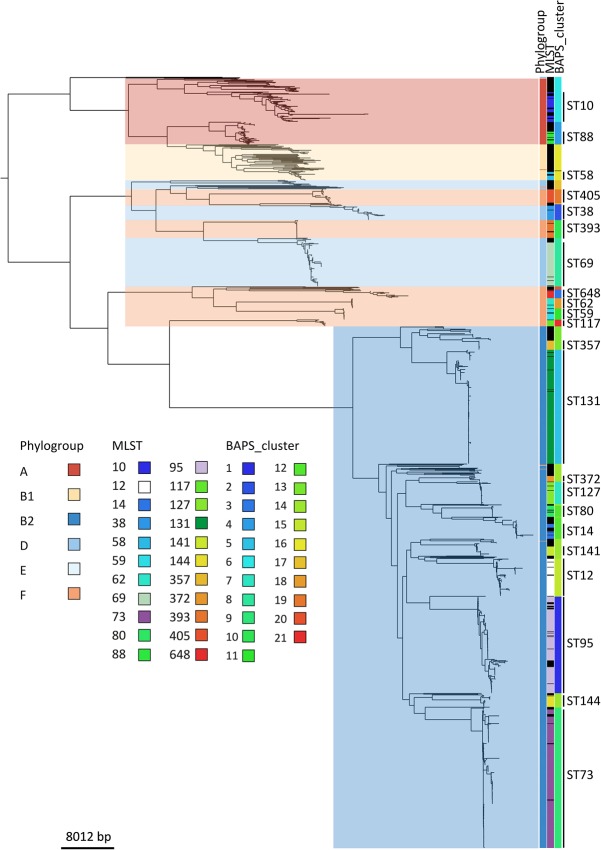
Figure 1.
Maximum-likelihood core genome phylogeny of E. coli associated with bacteremia in England. The columns on the right show, from left to right, phylogroup, STs containing more than 10 isolates, and hierBAPS clusters. Phylogroups are also presented by background shading and STs labeled on the right. Black represents ST designation not shown due to these having fewer than 10 isolates. The root has been placed according to previous understanding of Enterobacteriaceae phylogeny.

