
Figure 2. Inactivation of CGRPPBN neurons prevents cancer anorexia.
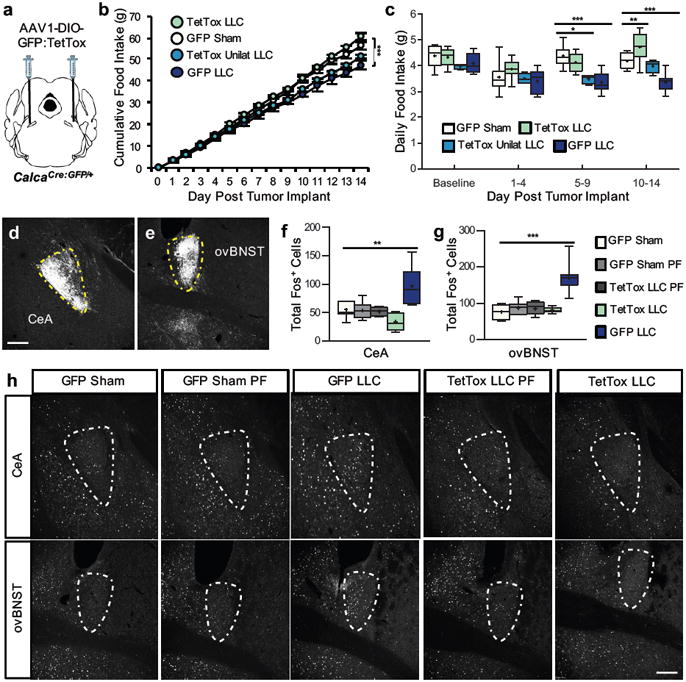
a, Stereotaxic injections of AAV1-DIO-GFP:TetTox (or AAV1-DIO-GFP control virus) into the PBN of CalcaCre:GFP/+ mice prior to LLC tumor implantation. b, Cumulative food intake following tumor implantation or sham treatment in mice with intact (GFP, n = 9), bilateral inactivation (TetTox, n = 8), or unilateral inactivation (TetTox Unilat, n = 4) of CGRPPBN neurons (two-way repeated measures ANOVA: Interaction, F(42, 350) = 19.99, p < 0.0001; Time, F(14, 350) = 4188, p < 0.0001; Treatment, F(3, 350) = 10.61, p = 0.0001). c, Average daily food intake at various time epochs (two-way repeated measures ANOVA: Interaction, F(9, 72) = 7.04, p < 0.0001; Time Epoch, F(3, 72) = 24.76, p < 0.0001; Treatment, F(3, 72) = 8.65, p = 0.0005). d-e, GFP-labeled axonal processes of CGRPPBN neurons in the CeA and ovBNST. Yellow, dashed outlines represent brain areas that were quantified for Fos expression. f-h, Quantification and representative images of Fos expression in the CeA (one-way ANOVA: F(4,38) = 12.79, p < 0.0001) and ovBNST (one-way ANOVA: F(4,38) = 25.00, p < 0.0001) of sham or tumor-bearing mice with intact (GFP) or inactivated (TetTox) CGRPPBN neurons. Line graphs show mean ± SEM. Box plots show mean (+), median, quartiles (boxes) and range (whiskers) for each treatment. * P ˂ 0.05, ** P ˂ 0.01, *** P ˂ 0.001. Scale bars are 100 µm. See also Supplementary Fig. 2.