
Figure 3. Established cancer anorexia is reversed with chemogentic inhibition of CGRPPBN neurons.
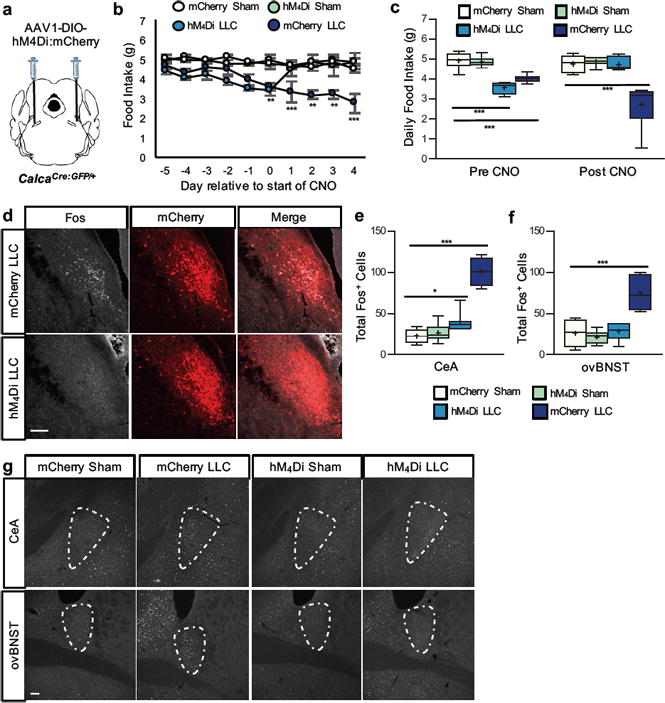
a, Stereotaxic injections of AAV1-DIO-hM4Di:mCherry or AAV1-DIO-mCherry control virus into the PBN of CalcaCre:GFP/+ mice prior to LLC tumor implantation. b, Daily food intake of sham-treated or tumor-bearing mice relative to the start of CNO treatment administered ip twice-daily at 2 mg/kg and in the drinking water (mCherry LLC, n = 8; mCherry Sham, n = 8; hM4Di LLC, n = 7; hM4Di Sham, n = 8; two-way ANOVA: Interaction, F(27, 237) = 3.34, p < 0.0001; Time, F(9, 237) = 2.72, p = 0.0049; Treatment, F(3, 237) = 44.53, p < 0.0001). c, Average daily food intake during the 4 d period prior to CNO treatment (Pre CNO) and all of the days after commencement of CNO treatment (Post CNO)(two-way ANOVA: Interaction, F(3, 54) = 17.55, p < 0.0001; Time, F(1, 54) = 0.37, p = 0.55; Treatment, F(3, 54) = 36.43, p < 0.0001). d, Representative images of Fos expression in the PBN of tumor-bearing mice with intact (mCherry) or inhibited (hM4Di) CGRPPBN neurons. e-g, Quantification and representative images of Fos expression in the CeA (one-way ANOVA: F(3, 30) = 74.56, p < 0.0001) and ovBNST (one-way ANOVA: F(3, 30) = 23.76, p < 0.0001) of sham or tumor-bearing mice with intact (mCherry) or inhibited (hM4Di) CGRPPBN neurons. Line graphs show mean ± SEM. Box plots show mean (+), median, quartiles (boxes) and range (whiskers) for each treatment. ** P ˂ 0.01, *** P ˂ 0.001. Scale bars are 50 µm. See also Supplementary Fig. 3.