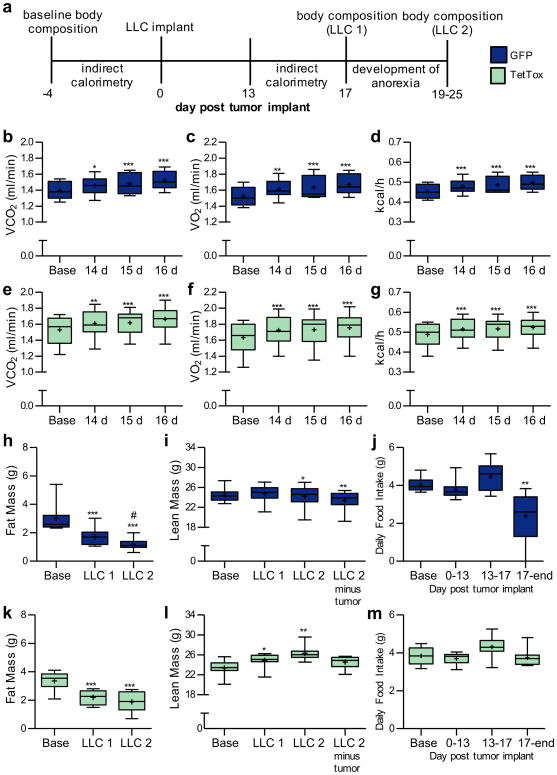
Figure 4. Role of CGRPPBN neurons in cancer-induced cachexia and increased energy expenditure.
a, Time course of experiments with CalcaCre:GFP/+ mice that previously underwent stereotaxic injections of AAV1-DIO-GFP:TetTox (or AAV1-DIO-GFP control virus) into the PBN. b-d, Calorimetry measurements from GFP control mice (n = 9) before (Base) and after tumor implantation (VCO2, one-way repeated-measures ANOVA: F(3, 35) = 15.62, p < 0.0001; VO2, one-way repeated-measures ANOVA: F(3, 35) = 15.99, p < 0.0001; kcal/h, one-way repeated-measures ANOVA: F(3, 35) = 19.27, p < 0.0001). e-g, Calorimetry measurements taken from TetTox mice (n = 9) before (Base) and after tumor implantation (VCO2, one-way repeated-measures ANOVA: F(3, 35) = 15.29, p < 0.0001; VO2, one-way repeated-measures ANOVA: F(3, 35) = 18.00, p < 0.0001; kcal/h, one-way repeated-measures ANOVA: F(3, 35) = 15.16, p < 0.0001). h-i, Fat and lean body mass measurements of GFP control mice before, 17 d after tumor implantation (LLC1), and after developing anorexia (LLC2); hashtag indicates significant difference (P ˂ 0.05) between LLC1 and LLC2 (Fat Mass, one-way repeated-measures ANOVA: F(2, 26) = 57.13, p < 0.0001; Lean Mass, one-way repeated-measures ANOVA: F(3, 35) = 5.736, p < 0.01). j, Average daily food intake of GFP mice before and after tumor implant (one-way repeated-measures ANOVA: F(3, 35) = 10.94, p < 0.0001). k-l, Fat and lean body mass measurements from TetTox mice before (Base), 17 d after tumor implantation (LLC1), and after developing anorexia (LLC2)(Fat Mass, one-way repeated-measures ANOVA: F(2, 26) = 69.74, p < 0.0001; Lean Mass, one-way repeated-measures ANOVA: F(3, 35) = 10.90, p < 0.001). m, Average daily food intake of TetTox mice before and after tumor implant (one-way repeated-measures ANOVA: F(3, 35) = 3.718, p < 0.05). Box plots show mean (+), median, quartiles (boxes) and range (whiskers) for each treatment. * P ˂ 0.05, ** P ˂ 0.01, *** P ˂ 0.001; asterisks indicate significant differences compared to baseline. See also Supplementary Fig. 4 and Supplementary Fig. 5.

