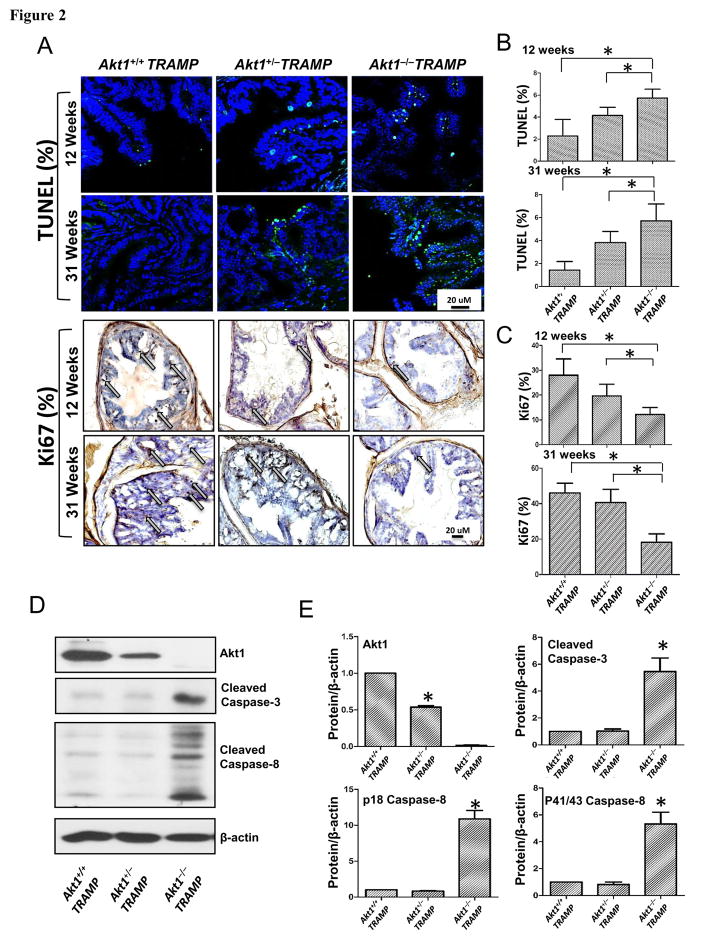
Figure 2. Akt1 deficiency increases apoptosis and inhibits proliferation in TRAMP mouse prostate.
(A) Representative images of 12 and 31 week old prostate tissue sections from TRAMP/Akt1+/+, TRAMP/Akt1+/−, TRAMP/Akt1−/− mice showing TUNEL and Ki67 staining (n=6). (B) Bar graphs showing quantification of the TUNEL positive cells in 12 and 31 week old TRAMP/Akt1−/− and TRAMP/Akt1+/− mice prostates compared to TRAMP/Akt1+/+ (n=6). (C) Bar graphs showing the number of Ki67 positive cells in 12 and 31 week old TRAMP/Akt1−/− and TRAMP/Akt1+/− mice prostates compared to TRAMP/Akt1+/+ (n=6). (D) Representative Western blot images and (E) bar graphs showing expression levels of Akt1, cleaved caspase-3, cleaved caspase-8 and β-actin in 31 week old TRAMP/Akt1+/+, TRAMP/Akt1+/−, TRAMP/Akt1−/− mice prostate tissue lysates (n=4). Data presented as Mean ± SD; *P < 0.05.

