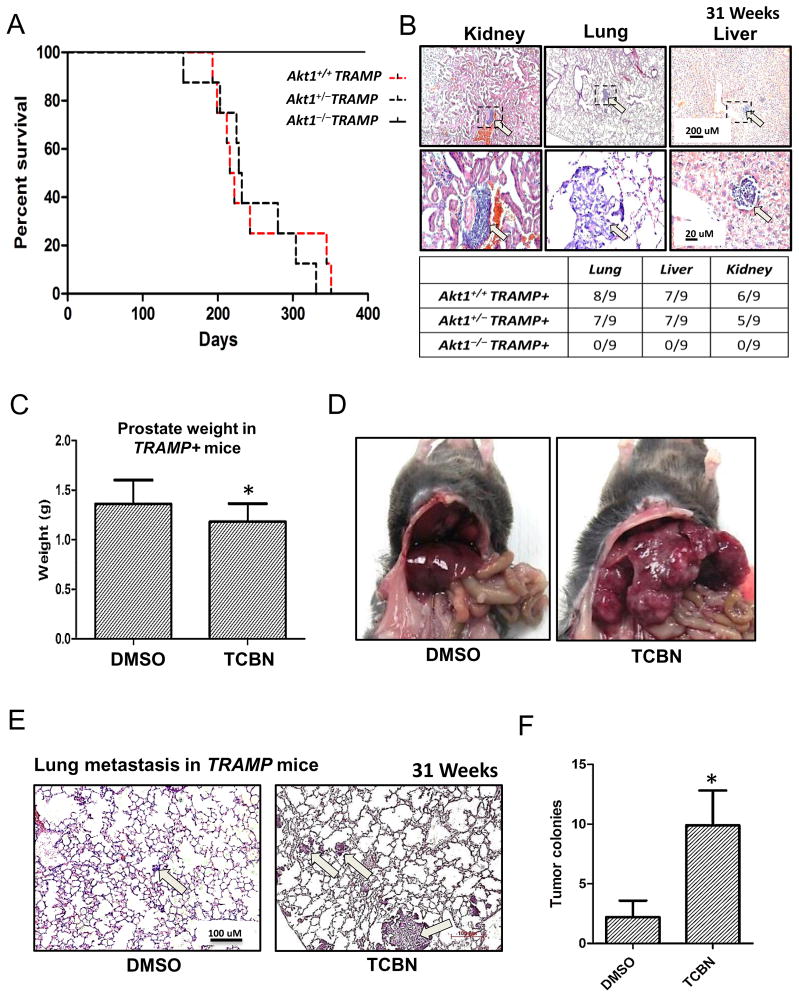
Figure 3. Pharmacological inhibition of Akt in 25 week old tumor bearing TRAMP mice promotes prostate cancer metastasis to the lungs.
(A) Kaplan-Meier plot showing increased lifespan of TRAMP/Akt1−/− mice compared to TRAMP/Akt1+/+and TRAMP/Akt1+/− mice (n=12). (B) Representative images of 31 week old kidney, lung and liver tissues isolated from TRAMP/Akt1+/+ mice showing metastatic tumor nodules. Table below indicate total absence of metastatic prostate cancer colonies in either the kidney, lung, and liver in TRAMP/Akt1−/− mice, and relatively the same number of metastatic prostate cancer colonies in the kidney, lung, and liver of the TRAMP/Akt1+/+and TRAMP/Akt1+/− mice (n=9). (C) Bar graph showing the weight of 31 week old TRAMP/Akt1+/+ prostate tumor treated for 6 weeks with DMSO (control) or Akt inhibitor (1mg/kg/day TCBN) (n=6). (D) Representative images of 31 week old TRAMP/Akt1+/+ mice viscera showing metastatic coloies in the livers treated with 1mg/kg/day TCBN for 6 weeks, compared to DMSO controls TCBN (n=6). (E) Representative images of 31 week old TRAMP/Akt1+/+ mice lung sections 6 weeks after treatment with DMSO or 1mg/kg/day TCBN (n=6). (F) Bar graph showing significantly higher number of prostate cancer colonies in 6 week TCBN-treated TRAMP/Akt1+/+ mice lung sections compared to DMSO-treated controls (n=6). Data presented as Mean ± SD; *P < 0.05.

