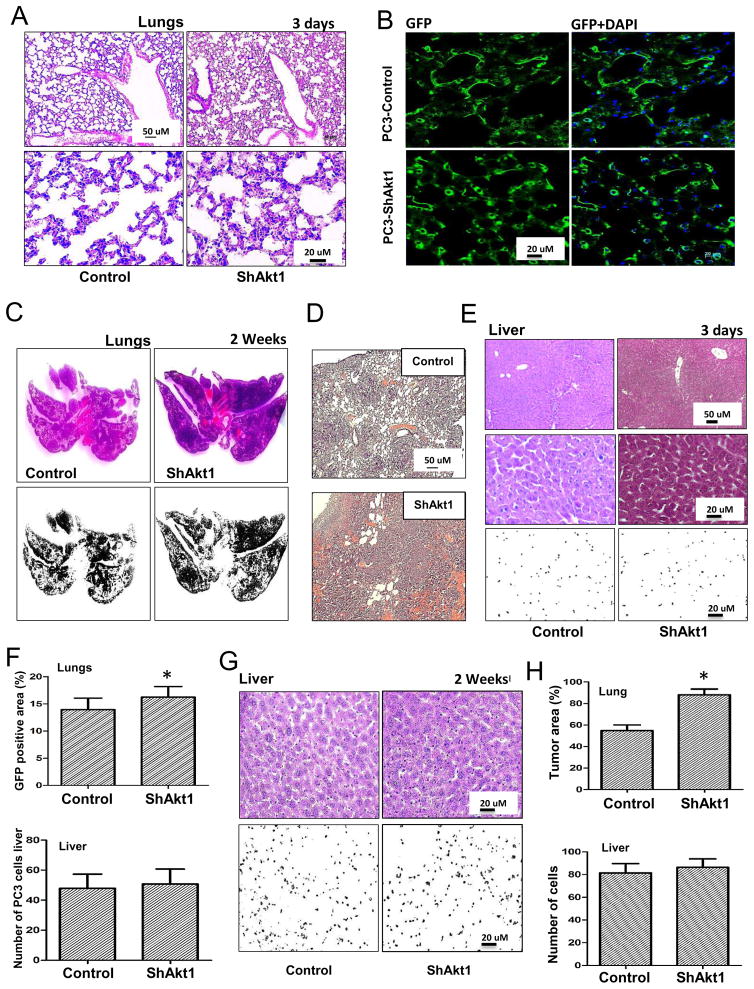
Figure 5. Increased metastasis and lung colonization by Akt1 knockdown PC3 cells compared to control PC3 cells in vivo.
(A) Representative images of H&E stained lung sections along with binary images from athymic nude mice pre-administered (via tail-vein; 3 days prior to analysis) with control or ShAkt1 PC3 cells. (B) Representative images of frozen lung sections from athymic nude mice pre-administered (via tail-vein; 3 days prior to analysis) with GFP-expressing control or Akt1 knockdown PC3 cells. (C–D) Representative images of H&E stained and binary images of the lung sections of athymic nude mice pre-administered (via tail-vein; 2 weeks prior to analysis) with Control or ShAkt1 PC3 cells. (E) Representative H&E stained and binary images of the liver sections from athymic nude mice pre-administered (via tail-vein; 2 weeks ago) with control or Akt1 knockdown PC3 cells showing increased number of tumor cells in mice administered with Akt1 knockdown PC3 cells compared to control. (F) Bar graphs showing the number of control and Akt1 knockdown GFP-positive PC3 cells in the lung (above) and number of PC3 cells in the binary images of liver sections (below) from athymic nude mice pre-administered with respective PC3 cells 3 days prior to tissue isolation (n=6). (G) Representative H&E stained and binary images of the liver sections from athymic nude mice pre-administered (via tail-vein; 2 weeks ago) with control or Akt1 knockdown PC3 cells. (H) Bar graphs showing the area of control and Akt1 knockdown PC3 cell tumor colonization in the lung (above) and the number of PC3 cells in the binary images of the liver sections (below) from athymic nude mice pre-administered with respective PC3 cells 2 weeks prior to tissue isolation (n=6). Data presented as Mean ± SD; *P < 0.05.

