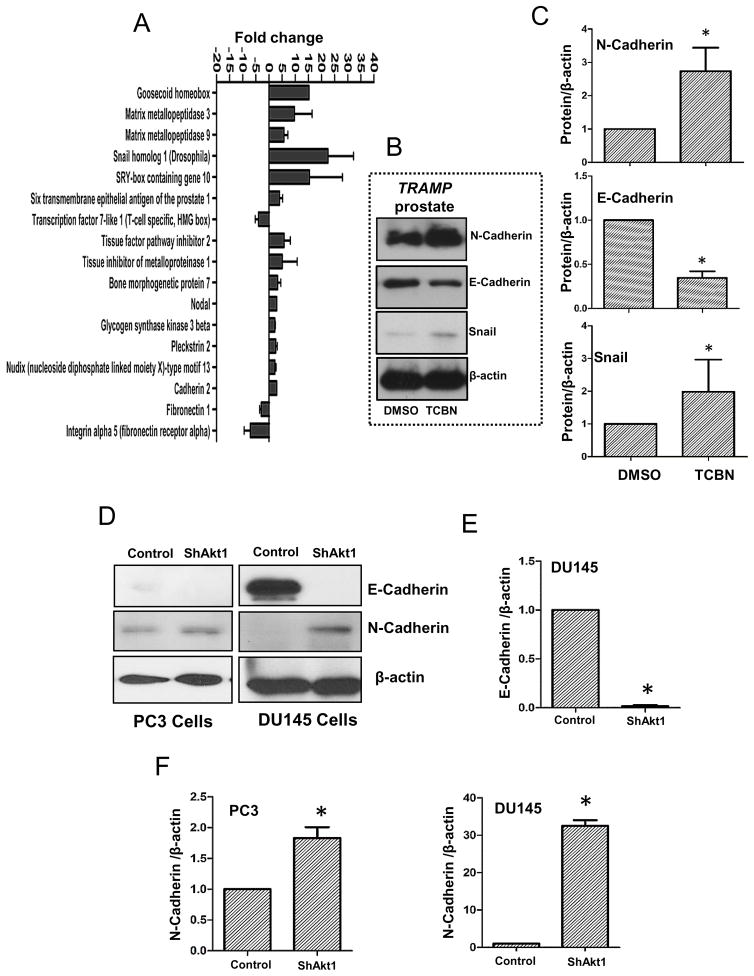
Figure 6. Pharmacological inhibition of Akt in TRAMP mice and genetic deletion of Akt1 in human prostate cancer cells promote epithelial to mesenchymal transition (EMT).
(A) Bar graph showing changes in the mRNA expression of genes regulating EMT in 31 week old TRAMP mice prostate tissues treated with 1mg/kg/day Akt inhibitor TCBN for 6 weeks (n=3). (B) Representative Western blot images of prostate tissue lysates isolated from 31 week old, 6 week TCBN (1mg/kg/day) treated TRAMP mice showing changes in the protein expression of epithelial and mesenchymal markers compared to DMSO treated controls. (C) Bar graphs showing average fold-changes in the expression levels of mesenchymal markers N-Cadherin and Snail, and epithelial marker E-cadherin in prostate tissue lysates isolated from 31 week old, 6 week TCBN treated TRAMP mice compared to DMSO treated controls (n=4). (D) Representative Western blot images of Akt1 knockdown human PC3 and DU145 cell lysates showing changes in the expression levels of epithelial marker E-cadherin and mesenchymal marker N-Cadherin compared to ShControl cells. (E) Bar graph showing average fold-change in the expression levels of epithelial marker E-Cadherin in Akt1 knockdown DU145 cell lysates compared to ShControl cell lysates (n=4). (F) Bar graphs showing average fold-change in the expression levels of mesenchymal markers N-Cadherin in Akt1 knockdown PC3 (left) and DU145 (right) cell lysates compared to respective control cell lysates (n=4). Data presented as Mean ± SD; *P < 0.05.

