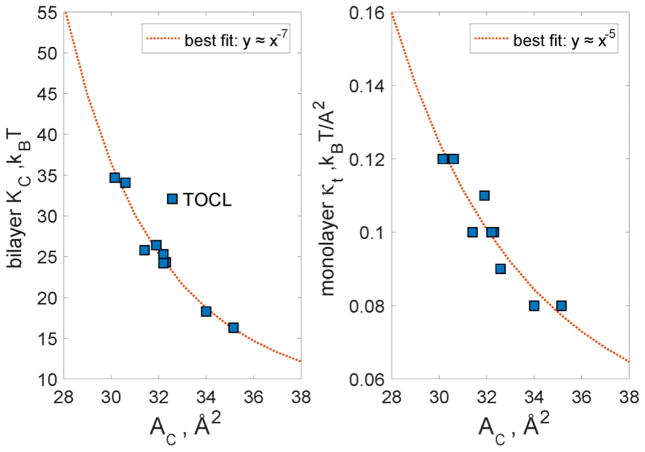
Figure 4.
Values for KC (left panel) and κt (right panel) calculated from the RSF analysis plotted against the respective areas per chain (AC) for all lipid bilayers from Fig. 3. The data was fit using a power law form and the best fit is shown as a dotted line. For KC, the best fit parameters were: c1=1.972e+12, c2=6.904, and α=7.328; For κt we found the best fit with: c1=1.903e+06, c2=0.03802, and α=4.971. The apparent outlier, TOCL was excluded from the fitting procedure on the left panel. The optimal scaling parameters reported in the legends of the two panels match earlier predictions from computational mean field theory for the respective relationships [26, 53]. See text for details.

