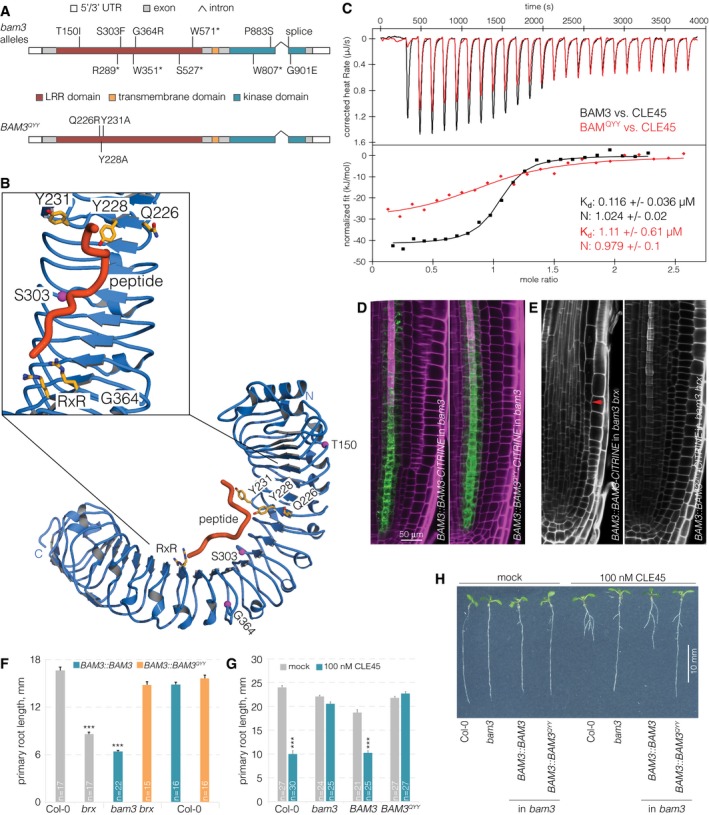
Schematic overview of the BAM3 gene structure. bam3 loss‐of‐function mutations that were isolated as second‐site suppressors of brx loss of function (top); amino acid point mutations predicted to disrupt BAM3‐CLE45 interaction (bottom).
Ribbon diagram of a homology model of the BAM3 LRR ectodomain (in blue) based on the HAESA ectodomain (PDB‐ID 5IXO). Magenta spheres indicate the position of genetic BAM3 missense mutations, and residues forming part of the predicted CLE45 binding site are shown in bonds representation (in yellow). The position of CLE45 has been inferred from an IDA‐HAESA complex (PDB‐ID 5IXQ).
Isothermal titration calorimetry (ITC) of purified BAM3 wild‐type (black) or mutant BAM3QYY (red) extracellular domains vs. CLE45 peptide. N: stoichiometry, K
d dissociation constant. Shown are experimental values ± fitting errors (95% confidence interval).
Expression of BAM3‐CITRINE wild‐type or mutant BAM3QYY fusion protein (green fluorescence) under control of the native BAM3 promoter in root meristems of bam3 mutants (magenta fluorescence: calcofluor white cell wall staining) (confocal microscopy).
Primary root meristems of bam3 brx double mutants carrying the indicated transgenes. Red arrow on the left panel indicates the approximate position of the final dividing cortex cell, which is out of range in the right panel.
Primary root length of 5‐day‐old seedlings of the indicated genotypes.
Primary root length of 7‐day‐old seedlings of the indicated genotypes in mock or CLE45 condition.
Representative 7‐day‐old seedlings of the indicated genotypes grown on standard mock or CLE45‐containing media.
Data information: Differences as compared to Col‐0 (F) or mock (G) are not statistically significant unless indicated (Student's
0.001; mean ± s.e.m.

