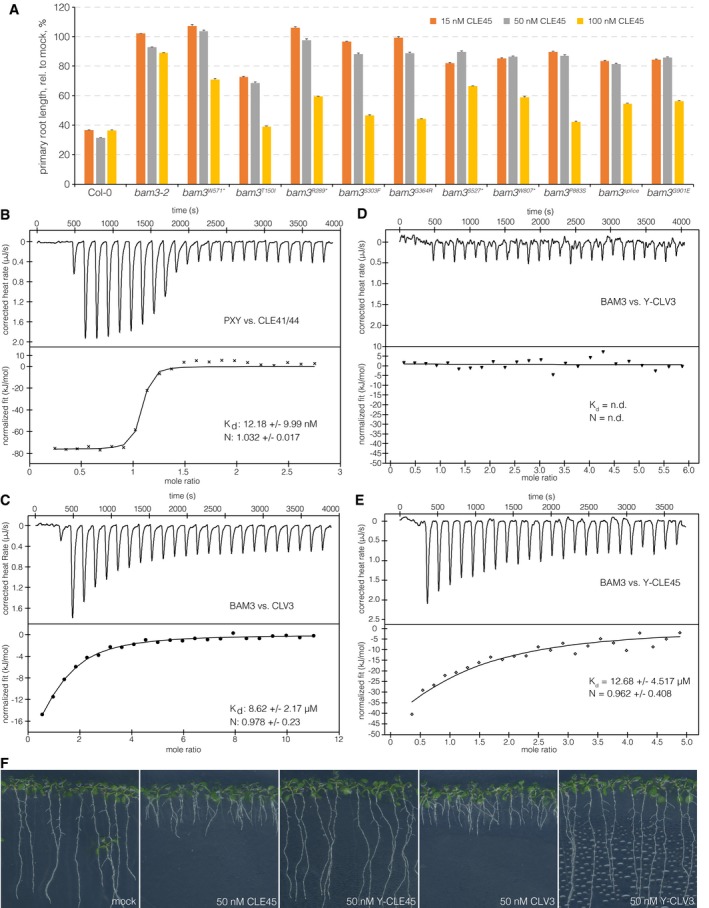
Figure EV1. BAM3‐CLE45 control experiments and bam3 alleles.

- Relative primary root length of indicated genotypes at 9 dag, in response to increasing amounts of CLE45 in the media. n = 12 for each genotype, mean ± s.e.m. All differences as compared to wild type were statistically significant (Student's t‐test) with P < 0.001 for 15 and 50 nM, and P < 0.05 for 100 nM.
- ITC of purified PXY extracellular domain vs. CLV41/44 peptide. n.d.: not detectable. N: stoichiometry, K d dissociation constant. Shown are experimental values ± fitting errors (95% confidence interval).
- ITC of purified BAM3 extracellular domain vs. CLV3 peptide.
- ITC of purified BAM3 extracellular domain vs. an N‐terminally tyrosine‐modified CLV3 peptide.
- ITC of purified BAM3 extracellular domain vs. an N‐terminally tyrosine‐modified CLE45 peptide.
- Representative 9‐day‐old Col‐0 seedlings grown on mock or in presence of indicated peptides.
