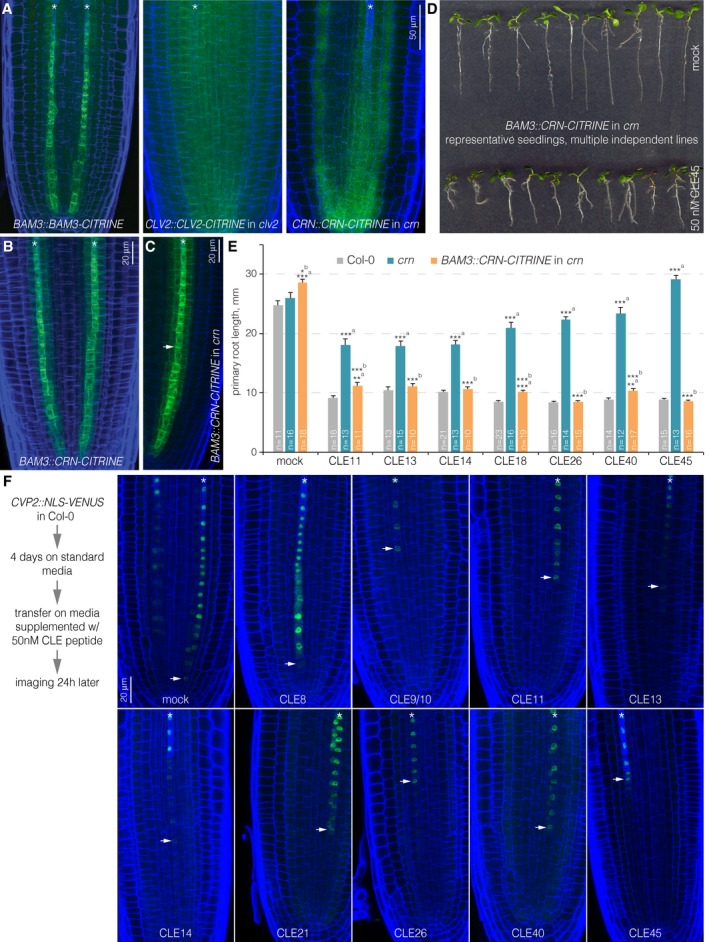
Figure 3. Protophloem‐specific CRN action in the root meristem.

-
AExpression pattern of BAM3, CLV2, and CRN‐CITRINE fusion proteins (green fluorescence) under control of their native promoters (blue fluorescence: calcofluor white cell wall staining) (confocal microscopy). Asterisks mark developing protophloem sieve element strands.
-
B, CExpression pattern of CRN‐CITRINE fusion protein under control of the BAM3 promoter in Col‐0 (B) or crn (C) background. Arrowhead in (C) highlights plasma membrane‐localized CRN.
-
DRepresentative 7‐day‐old crn seedlings expressing CRN‐CITRINE fusion protein under control of the BAM3 promoter grown on mock or CLE45.
-
EPrimary root length of 7‐day‐old seedlings of indicated genotypes, grown on mock or 50 nM of selected CLE peptides. Differences as compared to a: Col‐0 or b: crn are not statistically significant unless indicated (Student's t‐test); *P < 0.05; **P < 0.01; ***P < 0.001; mean ± s.e.m.
-
FExpression of nuclear localized, fluorescent VENUS protein under control of the CVP2 promoter (which specifically marks developing protophloem sieve elements), 24 h after transfer from standard media to 50 nM of selected CLE peptides. Arrowheads indicate the cells closest to the tip in which CVP2 expression was still detectable.
