-
A
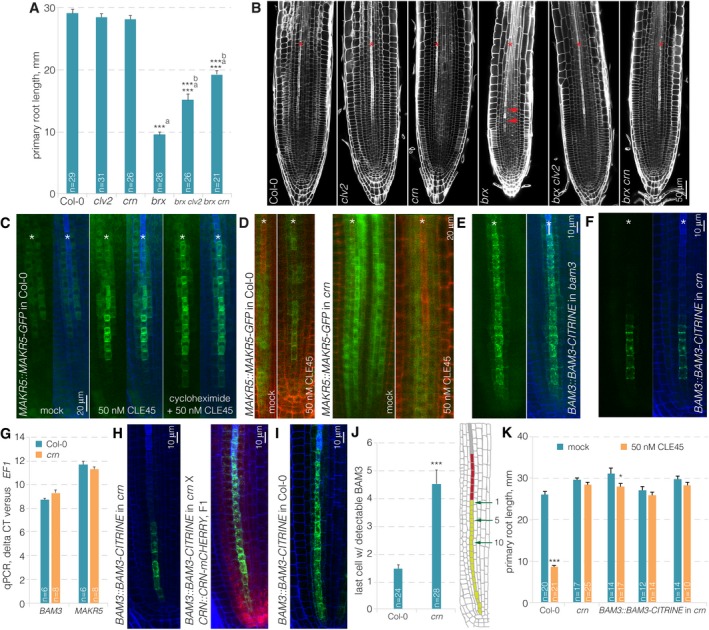
Primary root length of 9‐day‐old seedlings of indicated genotypes.
-
B
Root meristems of indicated genotypes (white fluorescence: calcofluor white cell wall staining) (confocal microscopy). Red arrowheads indicate the “gap” cells in brx.
-
C
MAKR5‐GFP fusion protein (green fluorescence) expressed under control of the native MAKR5 promoter in response to CLE45 application in the presence or absence of cycloheximide (blue fluorescence: calcofluor white cell wall staining). Green channel is shown separately (left) and in overlay with blue channel (right).
-
D
Response of MAKR5‐GFP fusion protein to CLE45 application in crn mutant background as compared to Col‐0 control (red fluorescence: propidium iodide cell wall staining).
-
E, F
Expression of BAM3‐CITRINE fusion protein under control of the BAM3 promoter in developing protophloem of bam3 (E) or crn (F).
-
G
qPCR of BAM3 expression in Col‐0 or crn root tips, with MAKR5 as control, relative to the EF1 housekeeping gene, representing the average for 2–3 technical replicates of three biological replicates, mean ± s.e.m. Differences were not statistically significant between Col‐0 and crn (Student's t‐test; P = 0.096 for BAM3, P = 0.273 for MAKR5).
-
H
Expression of BAM3‐CITRINE fusion protein (green fluorescence) under control of the BAM3 promoter in developing protophloem of crn (left panel) and in an F1 plant derived from a cross of the same line to a crn mutant complemented by a CRN::CRN‐mCHERRY (red fluorescence) transgene (right panel).
-
I
Expression of BAM3‐CITRINE fusion protein (green fluorescence) in Col‐0, as a parallel control for panel (J).
-
J
Quantification of the last proliferating protophloem cell (light green cells in the root schematic) with detectable BAM3‐CITRINE signal, with respect to the beginning of the protophloem transition zone (red cells).
-
K
Primary root length of 7‐day‐old seedlings of indicated genotypes on mock or CLE45 media, and several independent transgenic lines are shown.
0.001; mean ± s.e.m. Asterisks in (B‐F) mark developing protophloem sieve element strands.

