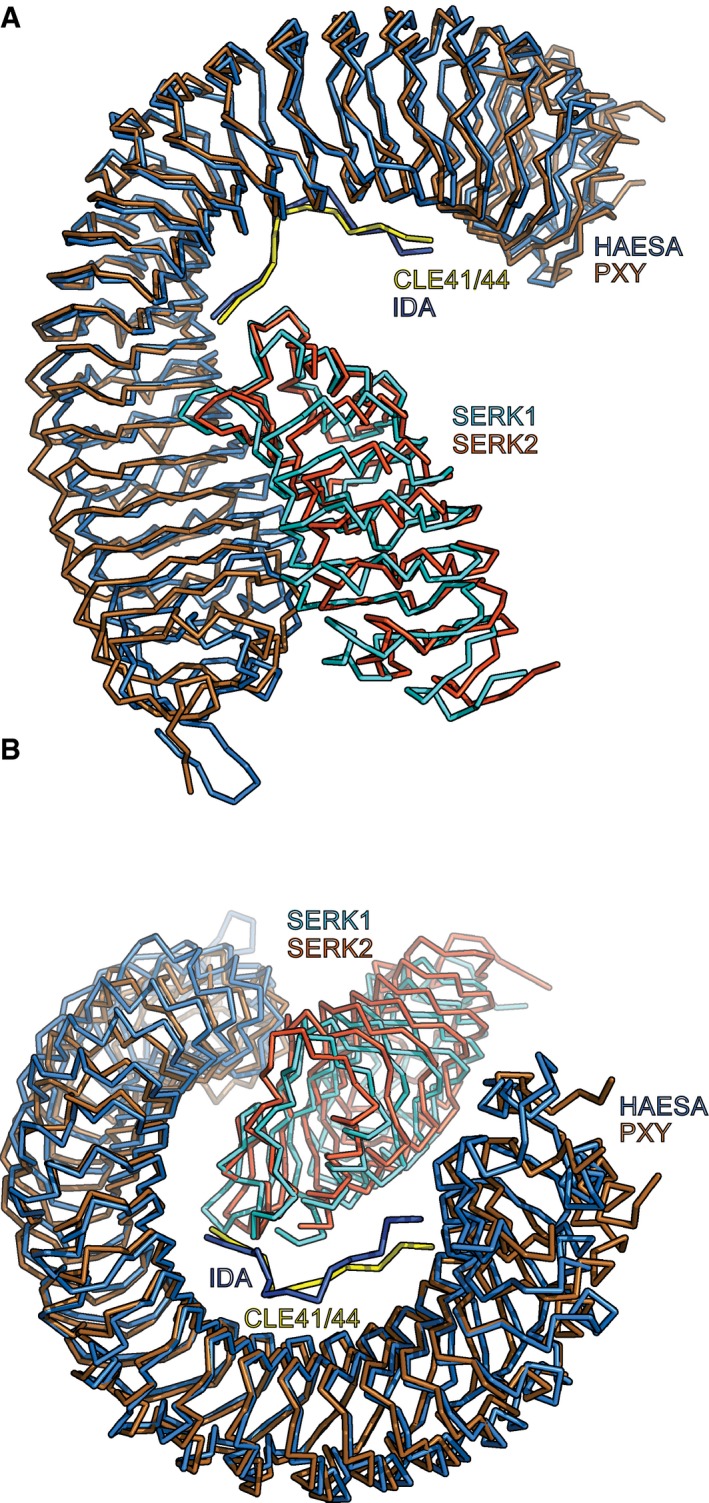
Figure EV5. Structure comparison of HAESA‐IDA‐SERK1 and PXY‐CLE41‐SERK2 signaling complexes.

-
A, BStructural superposition of HAESA‐IDA‐SERK1 (PDB‐ID 5IYX, HAESA in light blue, IDA in dark blue, and SERK1 in cyan) (Santiago et al 30) with a PXY‐CLE41/44‐SERK2 complex (PDB‐ID 5GQR, PXY in gold, IDA in yellow, and SERK2 in orange) (Zhang et al 45). The complexes closely align with an r.m.s.d. of 2.3 Å comparing 770 Cα atoms.
