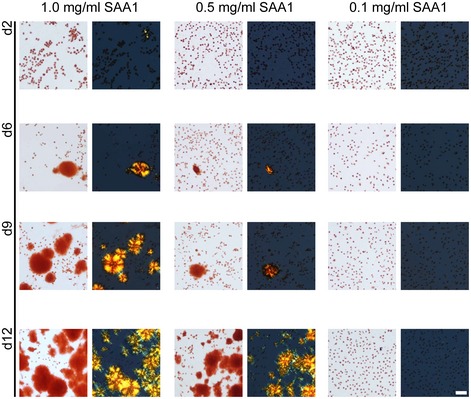
Figure 1. Effect of the SAA1 concentration on the kinetics of amyloid formation.

Bright field and dark field polarizing microscopy images of CR‐stained J774A.1 cells exposed for 2, 6, 9 and 12 days to 1.0, 0.5 or 0.1 mg/ml SAA1 and HDL. Scale bar: 50 μm.
