-
A
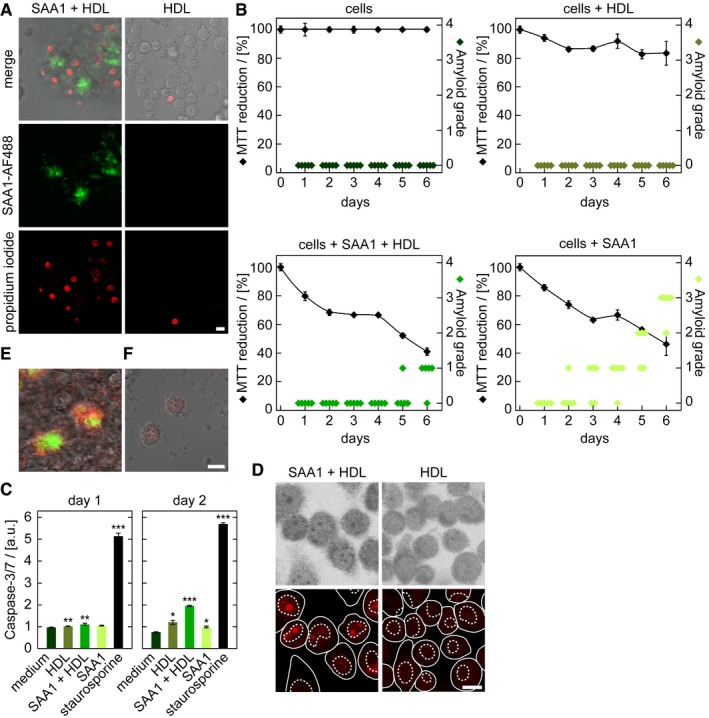
LSM images of PI‐stained J774A.1 cells exposed to HDL or HDL together with 0.5 mg/ml SAA1 and 0.01 mg/ml SAA1‐AF488 and HDL for 6 days. Scale bar: 10 μm.
-
B
MTT‐based cell viability measurements (black, n = 4) and quantitative estimation of amyloid load by CR staining (green, n = 5) of cells incubated with or without 0.5 mg/ml SAA1 and HDL as indicated. The sample incubated only with medium was set to 100%.
-
C
Caspase‐3/7 activity of cells incubated with 0.5 mg/ml SAA1, HDL or the cell toxin staurosporine for up to 2 days (n = 3). a.u.: arbitrary units.
-
D
LSM images after applying the TUNEL assay to monitor apoptosis in J774A.1 cells incubated for 3 days with 0.5 mg/ml SAA1 and HDL as indicated. Scale bar: 10 μm.
-
E, F
LSM images of cells exposed for 6 days to HDL (F) or 0.5 mg/ml SAA1, 0.01 mg/ml SAA1‐AF488 (green) and HDL (E). Afterwards, cells were killed by methanol fixation and the culture dish was further incubated with 0.5 mg/ml SAA1, 0.01 mg/ml SAA1‐AF647 (red) and HDL for 1 day. Scale bar: 10 μm.
Data information: In (B and C), data are presented as mean ± SD. *
P < 0.05; **
P < 0.01; ***
P < 0.001 (Student's
t‐test). In (D) the circles represent cells and the dotted line circles represent the nuclei.

