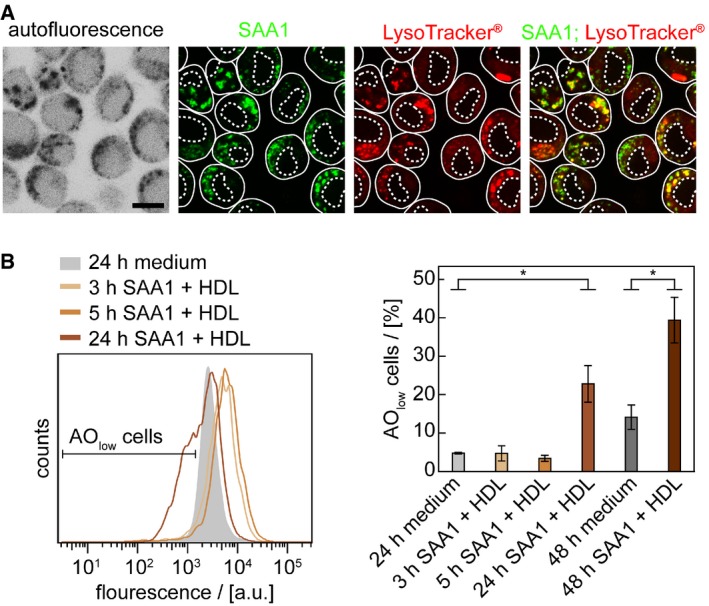
Figure 5. Intracellular fibril formation induces lysosomal leakage.

- LSM images of cells incubated with 0.5 mg/ml SAA1, 0.01 mg/ml SAA1‐AF488 and HDL for 24 h and stained with LysoTracker® Red DND‐99 (red), a marker of acidic organelles. Scale bar: 10 μm.
- Cells were incubated with or without 0.5 mg/ml SAA1 and HDL for up to 48 h, stained with pH‐sensitive dye AO, analysed by flow cytometry using an EX wavelength of 488 nm and an EM filter from 673 to 727 nm (n = 3). Data are presented as mean ± SD. *P < 0.05 (Student's t‐test).
