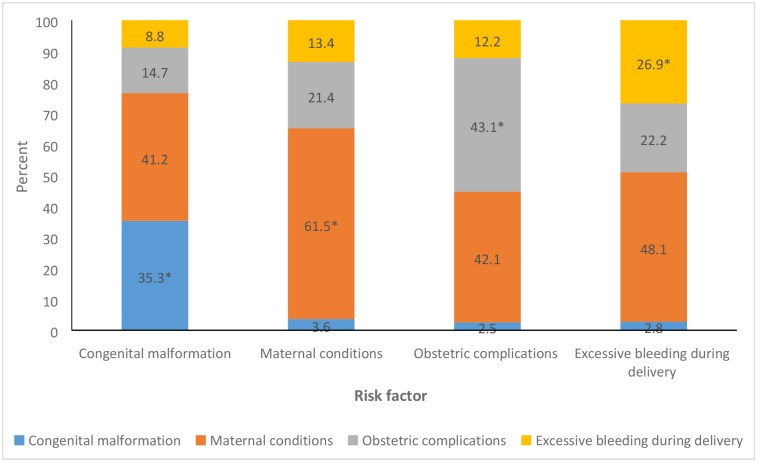
Fig 4. The distribution of the overlap between the various possible risk factors for stillbirth in the Indian state of Bihar.
Each bar denotes a risk factor indicated on the x-axis, and the stacks in each bar denote the overlap with the other risk factors. *Denotes no overlap with another risk factor.

