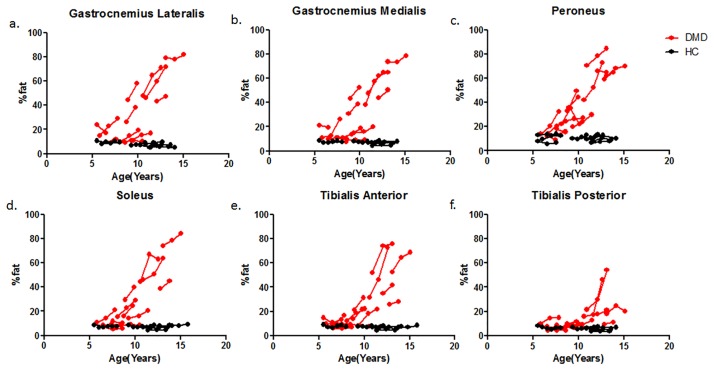
Fig 5. Individual trajectories of fat fraction plotted as a function of age in DMD patients (Red) and HC subjects (Black) for the GCL (a), GCM (b), PER (c), SOL (d), TA (e) and TP (f) muscle.
The dots with a connecting line represent an individual subject. Fat fractions were significantly increased compared to controls in all muscles and all time points with the exception of the TP and TA muscle.

