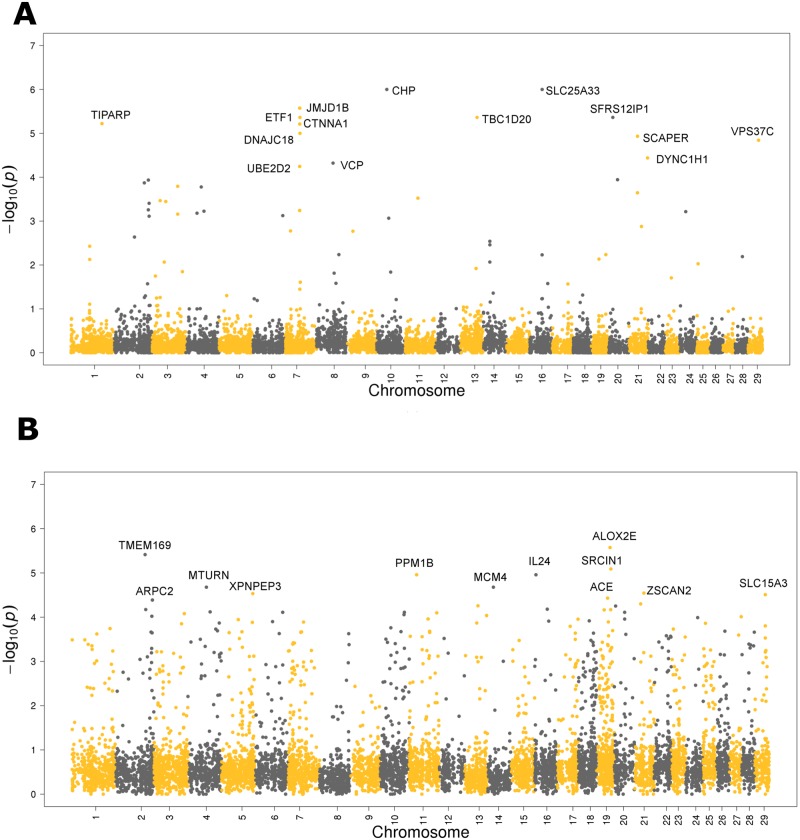
Fig 5. Genome-wide distribution plots depicting the highly contributing genes to the Bos indicus and Bos taurus contents in the bovine genome.
Each point corresponds to a gene from our list of 8,631 genes along the genome. The likelihood of a gene being of Bos indicus or Bos taurus origin is plotted along the Y-axis. (A) Genes with high Bos indicus (low Bos taurus) content (B) Genes with low Bos indicus (high Bos taurus) content.

