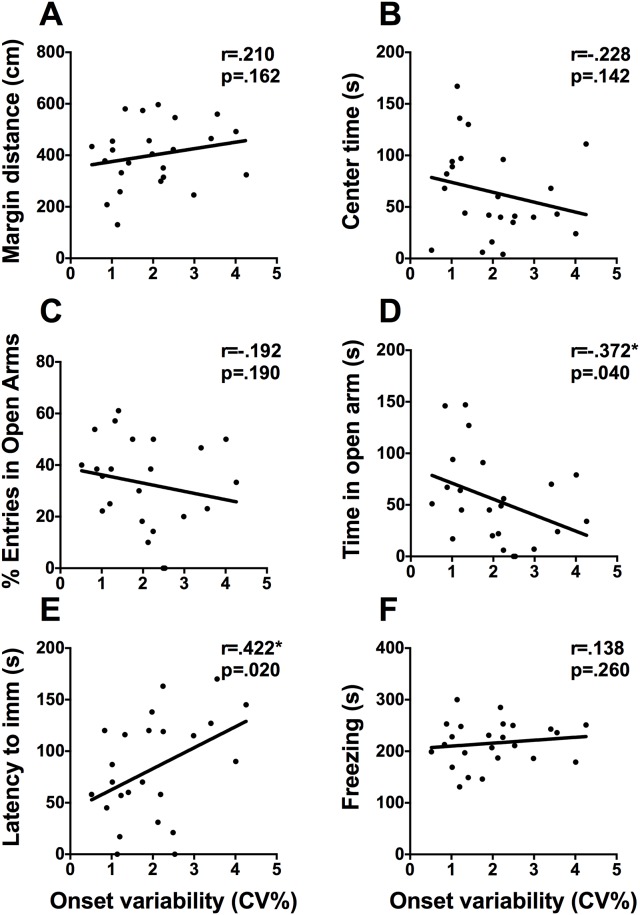
Fig 5. Variability in onset is associated with performance on the EPM and FST.
Scatterplots representing the relationships between variability in onset (CV) and (A) distance travelled in the margins of the activity box, (B) time spent in the center of the activity box, (C) percent of open arm entries, (D) time spent in the open arms of the EPM, (E) latency to immobility in the FST, and (F) time spent freezing on day 2 of contextual fear conditioning. * p <.05, ** p <.01.

