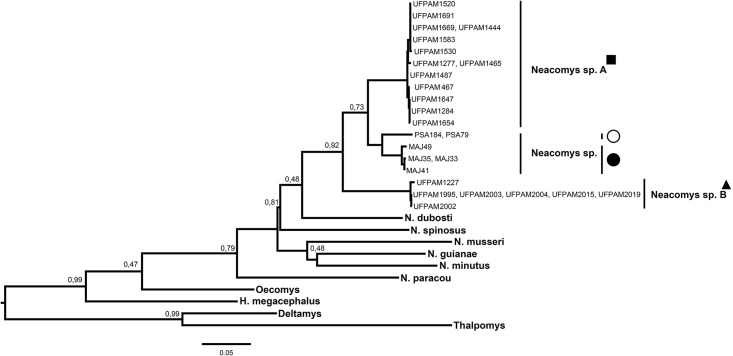
Fig 5. Maximum likelihood tree of specimens of Neacomys, based on haplotypes from 58 sequences of the concatenated mitochondrial genes (COI and Cytb).
Bootstrap values are shown above the nodes. The symbols refer to species mentioned in Fig 1. Legend: black square (Neacomys sp. A), black triangle (Neacomys sp. B), white circle (Neacomys sp. from Marabá) and black circle (Neacomys sp. from Marajó island) [28].

