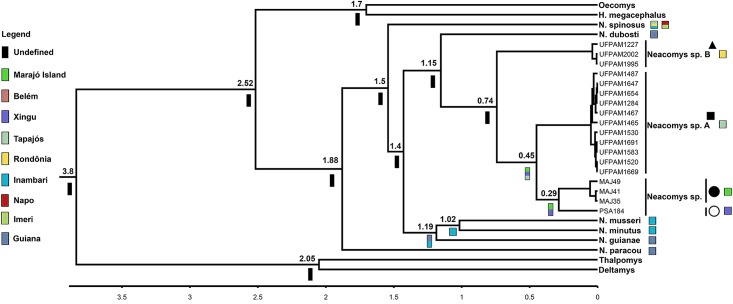
Fig 7. Chronogram derived from a Bayesian analysis of the concatenated mitochondrial genes (COI and Cytb) of Neacomys genus.
The scale shows divergence times as millions of years ago (Ma). Colored bars correspond to ancestral areas recovered by Vicariance-Dispersion analysis, to Marajó island and Amazon endemic areas mentioned in Fig 1. The symbols refer to species mentioned in Fig 1. Legend: black square (Neacomys sp. A), black triangle (Neacomys sp. B), white circle (Neacomys sp. from Marabá) and black circle (Neacomys sp. from Marajó island) [28].

