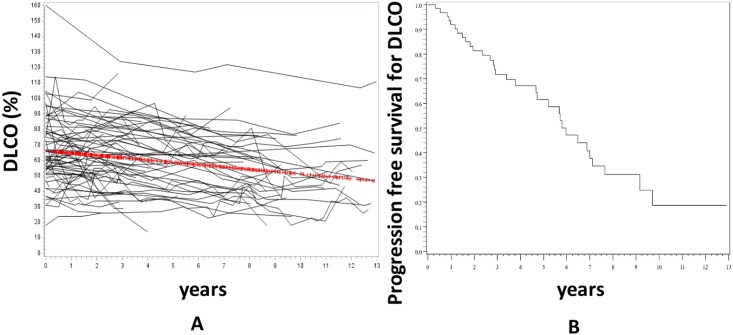
Fig 2. Evolution of DLCO during the follow up.
Panel A represents the individual data of the 75 patients and the red line is the trajectory of DLCO using the linear mixed model with random effect. DLCO significantly decreased over time (-1.5±0.3%/year (p<0.0001). Panel B is the progression-free survival of DLCO. Progression was defined as a decline of ≥15% of baseline DLCO.

