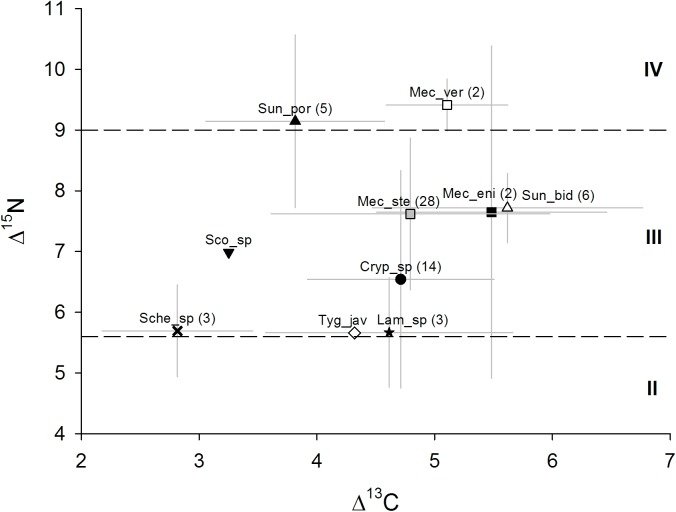
Fig 2. Mean (± SD) stable isotope values of centipede species.
Data are normalized to the value of plant litter of the respective sampling site. Dashed horizontal lines represent estimated trophic level boundaries based on the mean leaf litter δ15N value, primary decomposers were assumed to constitute the first trophic level with mean values of approximately 0.5‰ above those of leaf litter [71], each trophic level was assumed to span 3.4‰ [34,35,72]; II = secondary decomposers and first order predators, III = second order predators, IV = third order predators. Numbers in brackets indicate the number of replicates; for full species names see Table 1.

