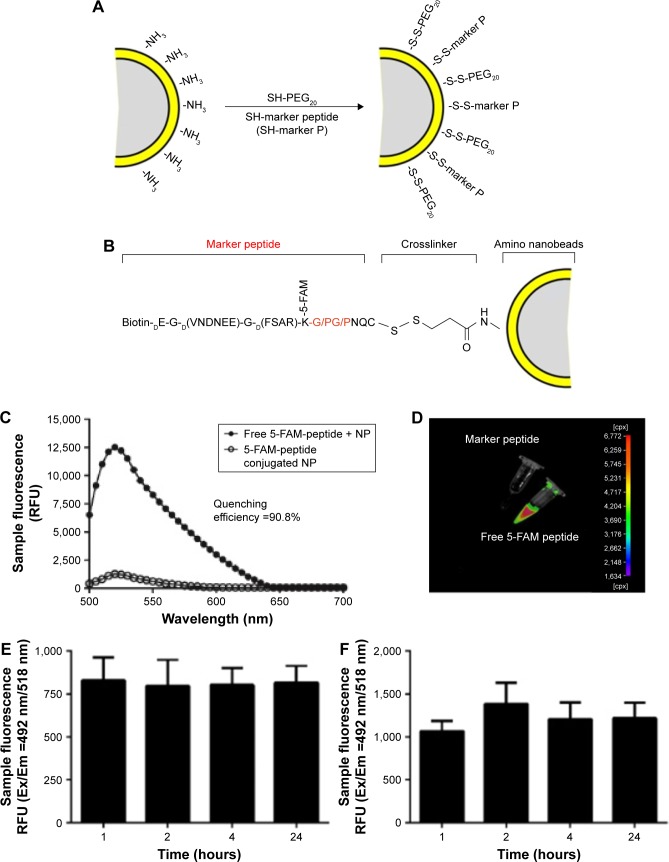
Figure 1.
Structure analysis of marker-MNPs.
Notes: (A) Structural diagram of naked nanobeads. (B) Structural diagram of marker-MNPs. Red fonts indicate restriction sites of FAPα. (C) Fluorescence spectra of marker-MNPs conjugated with fluorescein-labeled peptides and naked beads incubated with an equivalent amount of free fluorescein-labeled peptides (excitation: 492 nm; emission: 500–700 nm; quenching efficiency =90.8%). (D) Fluorescent image of fluorescence quenching. (E) Average fluorescence of marker-MNPs incubated in 10% mouse serum at 37°C over time (excitation: 492 nm; emission: 518 nm). (F) Average fluorescence of marker-MNPs incubated in urine of mice at 37°C over time.
Abbreviations: MNPs, magnetic iron oxide nanoparticles; RFU, relative fluorescence unit.

