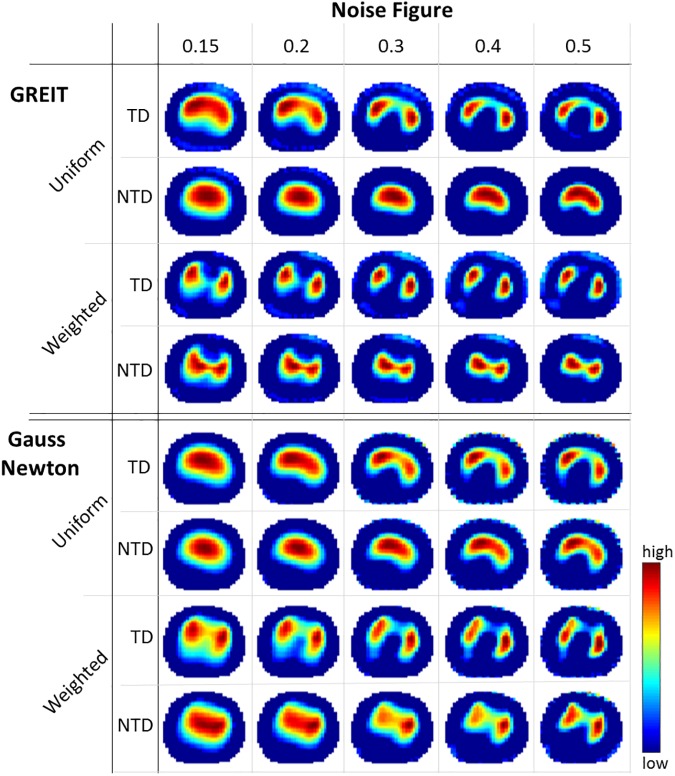
Fig 2. Reconstructed EIT images.
Reconstructed EIT images showing tidal impedance changes (red = high, blue = low) using different settings for GREIT and Gauss Newton. Noise figure controls smoothing of the images, time difference (TD) and normalized time difference (NTD) are voltage reference methods, and weighted reconstruction–in contrast to uniform reconstruction–considers that lungs are less conductive than the surrounding tissue. Images are zeroed at a threshold of 10% to reduce artifacts.

