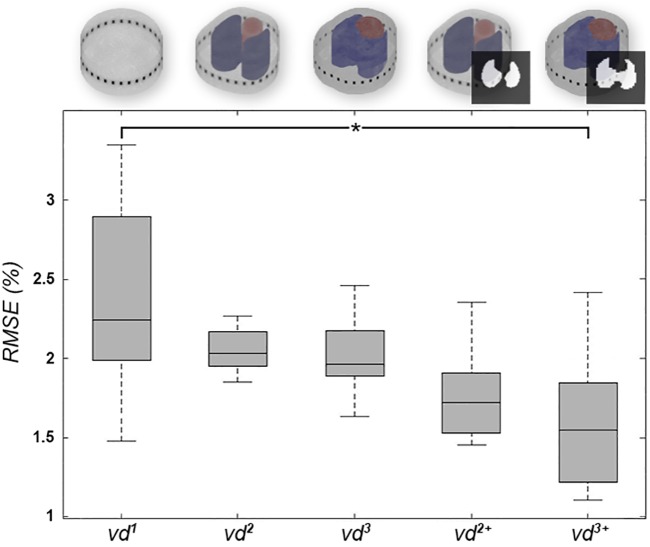
Fig 4. RMSE values of all animals.
Boxplots for RMSE values over all pigs (n = 8). The circular model (vd1) showed high variation and high error, whereas RMSE decreased with the addition of anatomical information in vd2, vd2+ and vd3. RMSE was significantly lower after adding further individual anatomical information in vd 3+ (p < 0.03).

